Review
. 2010 Oct;52(2):192-200.
doi: 10.1016/j.ymeth.2010.06.010. Epub 2010 Jun 8.

Single-molecule FRET of protein-nucleic acid and protein-protein complexes: surface passivation and immobilization

Affiliations
Review

Single-molecule FRET of protein-nucleic acid and protein-protein complexes: surface passivation and immobilization

Rajan Lamichhane et al. Methods. 2010 Oct.

Abstract

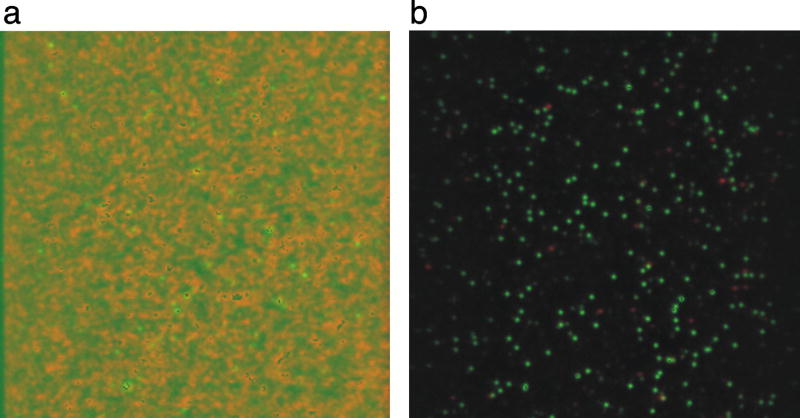
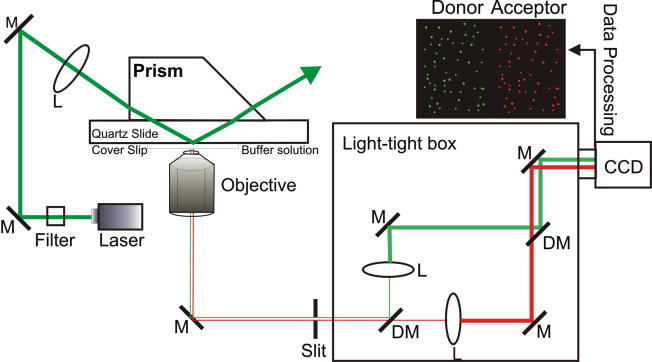
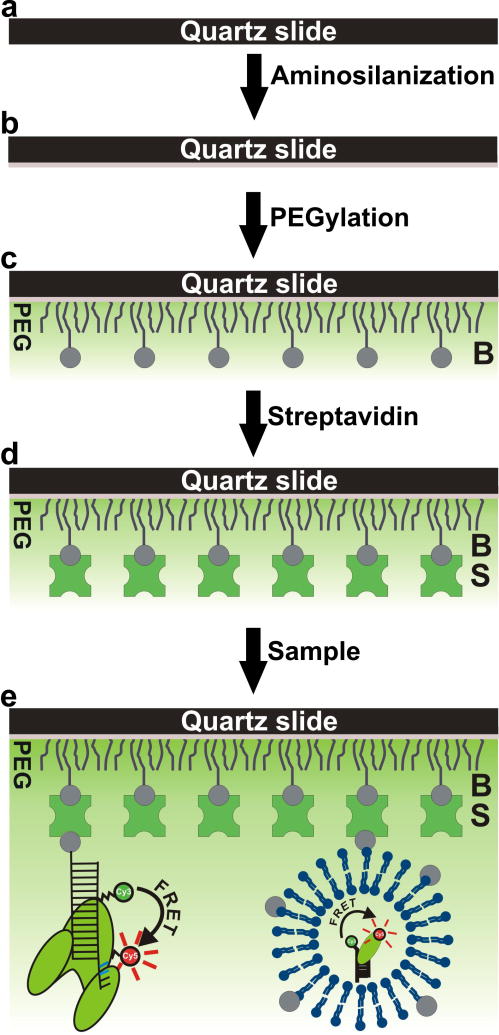
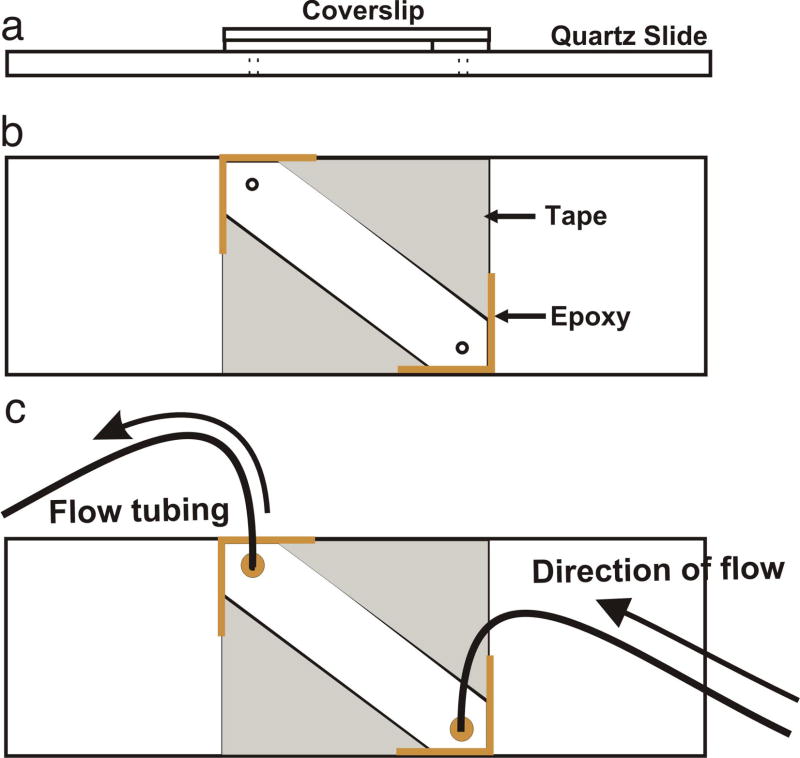
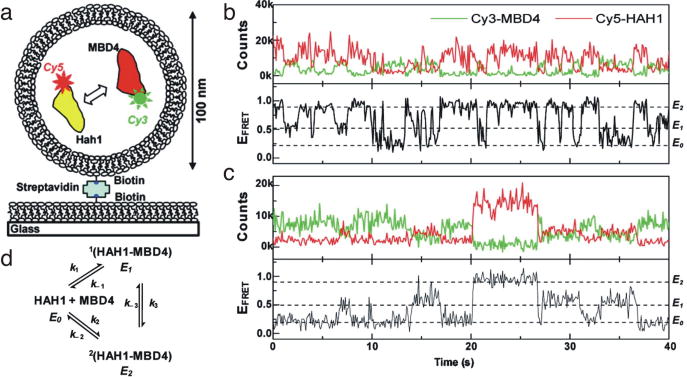
Single-molecule fluorescence spectroscopy reveals the real time dynamics that occur during biomolecular interactions that would otherwise be hidden by the ensemble average. It also removes the requirement to synchronize reactions, thus providing a very intuitive approach to study kinetics of biological systems. Surface immobilization is commonly used to increase observation times to the minute time scale, but it can be detrimental if the sample interacts non-specifically with the surface. Here, we review detailed protocols to prevent such interactions by passivating the surface or by trapping the molecules inside surface immobilized lipid vesicles. Finally, we discuss recent examples where these methods were applied to study the dynamics of important cellular processes at the single-molecule level.


Figures

Figure 1
Figure 1
PEGylation drastically reduces protein-slide non-specific interactions. Overlayed images of two-color emission for donor (green) and acceptor (red). To generate these images, we surface immobilized a single stranded RNA substrate labeled with Cy3 (donor) and Cy5 (acceptor) and added 10 nM of the RNA binding domains 3 and 4 of the polypyrimidine tract binding protein (PTB34) in solution (49) (a) The same sample on a slide without PEG passivation is uninterpretable, as the protein crashes onto the slide surface. (b) On a PEG slide, the protein-RNA sample provides clear and high-quality single molecule data.
Figure 2
Figure 2
Schematic diagram of excitation and single FRET pair emission for prism-based TIRF. The excitation beam reaches the slide-solution interface and creates an evanescent wave that excites immobilized molecules in aqueous solution. The emission from donor and acceptors are collected through an inverted microscope objective and passed through a slit into a light-tight box, where the donor (green) and acceptor (red) emissions are physically separated. Finally, the two emission signals are detected side-by-side by an electron multiplied back illuminated CCD camera.
Figure 3
Figure 3
Stepwise representation of surface passivation and sample immobilization. (a) The slide surface is cleaned. (b) The slide is aminosilanized and ready for PEGylation. (c) PEG and biotin-PEG molecules are conjugated to the amine-modified surface (d) Streptavidin is bound to the immobilized biotin-PEG molecules. (e) The sample can either be surface-tethered with an attached biotin or indirectly immobilized after being encapsulated in a biotinylated lipid vesicle. After washing to remove unbound sample, the slide is ready for use.
Figure 4
Figure 4
Diagram detailing slide specifications for single molecule experiments. (a) Top view of an assembled microscope slide. (b) Slide with 22 mm long, 8 mm wide and 200 μm deep microfludic channel prepared using two layers of double-sided tape between the quartz slide and cover slip. The assembly is sealed with epoxy at the edges to prevent leaking from the channel. (c) Slide in b with an attached flow tubing for injection of sample.
Fig. 5
Fig. 5
Microscopy images of vesicles extruded with 200 nm pore size membranes. (a) Brightfield images of 4 vesicles (left panel). The black arrow indicates the vesicle shown as a profile plot (right panel) with the indicated width of a Gaussian fit. Due to the physical properties of vesicles and/or the resolution limit of the microscope, the vesicles appear as a bright circle surrounded by a dark ring. For these reasons, vesicle images may not accurately reflect vesicle size. (b) Fluorescent images of 4 vesicles that contain rhodamine-labeled lipid (1,2-dipalmitoyl-sn- glycerol-3-phosphoethanolamine-N-(lissamine rhodamine B sulfonyl) (ammonium salt) from Avanti Polar Lipids). The black arrow indicates the vesicle shown as a profile plot (right panel) with the indicated width of a Gaussian fit. Again, the images may not accurately reflect vesicle size due to resolution limits of the microscope.
Fig. 6
Fig. 6
Single molecule study of the bI5 group I intron and its folding dynamics in the presence of CBP2. (a) The secondary structure of the bI5 group I intron showing positions of Cy3, Cy5, and biotin. (b) The proposed two-step model for the formation of bI5-CBP2 complex (upper panel) and the respective single molecule FRET trajectories (lower panel). In the absence of the protein (left), the RNA collapses to a 0.3 FRET state and makes transient excursions to a 0.8 FRET state with native-like features. In the presence of CPB2, a rapid and non-specific binding occurs first, which cause a large conformational fluctuation as shown by the single molecule FRET trajectories (middle). Finally, the slow and specific binding of CBP2 protein to RNA forms a stable (0.8 FRET state) and catalytically active CBP2-bI5 complex (right). This figure was reprinted from (47) with permission from Elsevier.
Fig. 7
Fig. 7
Single molecule study of single nucleotide incorporation by a DNA polymerase. (a) Schematic representation of DNA polymerase dynamics showing four different steps. The corresponding FRET values are indicated. F- fingers, P- palm T- thumb, and E- exonuclease (b) A FRET time trace illustrating the different states of the polymerase-bound primer-template complex. The polymerase, transient and exonuclease sites are marked according to their FRET values. (c) A 15-mer-primer template duplex showing the positions of the three products with arrows. (d) FRET trajectory showing the single nucleotide (dTTP) incorporation in the left and three-nucleotide incorporation (dTTP, dATP and dGTP) in the right. Arrows indicate the times at which a nucleotide is being incorporated. This figure is reprinted from (3) with permission.
Fig. 8
Fig. 8
Single-molecule studies of vesicle-encapsulated RecA and ssDNA. (a) This model depicts RecA filament assembly and disassembly on ssDNA in the presence of ATP. Upon addition of ATPγS, the ATP is displaced and the RecA filament is stably assembled. (b) A single-molecule time trace of an encapsulated ssDNA with RecA. In the presence of ATPγS, the low FRET state persists. As ATP displaces ATPγS, the system becomes dynamic, transitioning between the high and low FRET states. (c) The frequency of reassembly of RecA filaments at various concentrations using surface tethered DNA compared to that in lipid vesicles. This figure was reprinted from (45) and is copyrighted to the National Academy of Sciences.
Fig. 9
Fig. 9
Single-molecule study of Hah1-MBD4 interactions. (a) Cy3-MBD4 and Cy5-Hah1 were encapsulated in 100 nm vesicles and immobilized to the slide. (b) Time traces from two individual vesicles that each contain one Cy3-MBD4 and one Cy5-Hah1. E0, ~0.2 FRETunbound state. E1, ~ 0.5 FRET bound state. E2, ~ 0.9 FRET bound state. (c) Hah1/MBD4 binding schematic. The determined rate constants are: k1 = 4.7 ± 0.7 x 10⁵ M−1s−1, k−1 = 1.8 ± 0.1 s−1, k2 = 2.5 ± 0.4 x 10⁵ M−1s−1, k−2 = 1.5 ± 0.1 s−1, k3 = 1.4 ± 0.2 s−1, k−.3 = 2.4 ± 0.3 s−1. Reprinted from (58) with permission from JACS.

References

    1. Abbondanzieri EA, Greenleaf WJ, Shaevitz JW, Landick R, Block SM. Nature. 2005;438:460–5. - PMC - PubMed
    1. Herbert KM, Greenleaf WJ, Block SM. Annu Rev Biochem. 2008;77:149–76. - PMC - PubMed
    1. Christian TD, Romano LJ, Rueda D. Proc Natl Acad Sci U S A. 2009;106:21109–14. - PMC - PubMed
    1. Sorokina M, Koh HR, Patel SS, Ha T. J Am Chem Soc. 2009;131:9630–1. - PMC - PubMed
    1. Blanchard SC, Gonzalez RL, Kim HD, Chu S, Puglisi JD. Nat Struct Mol Biol. 2004;11:1008–14. - PubMed

Publication types

MeSH terms