

Mechanism of substrate specificity in 5'-methylthioadenosine/S-adenosylhomocysteine nucleosidases
- PMID: 20554051
- PMCID: PMC3006453
- DOI: 10.1016/j.jsb.2010.06.006
Mechanism of substrate specificity in 5'-methylthioadenosine/S-adenosylhomocysteine nucleosidases
Abstract
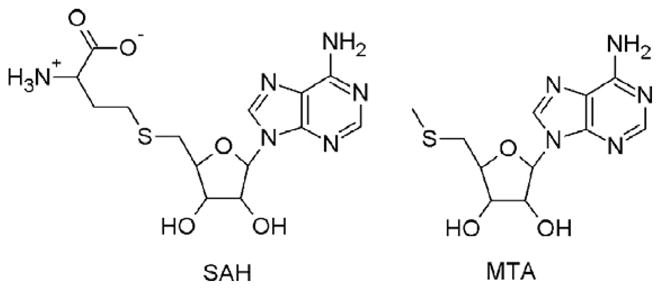
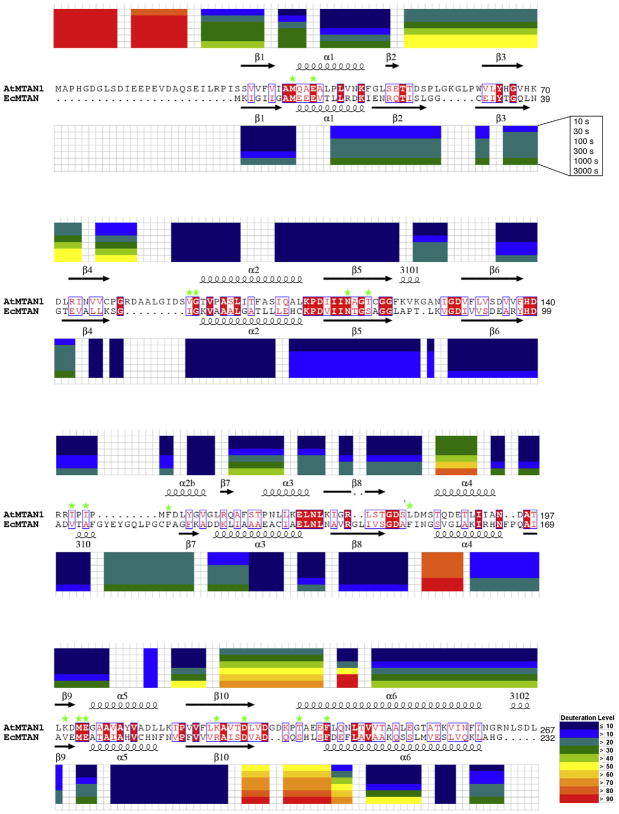
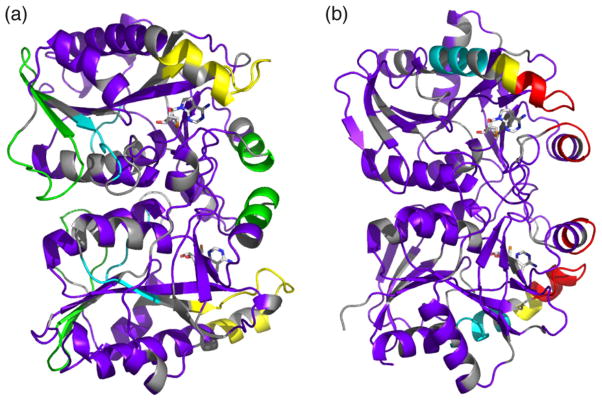
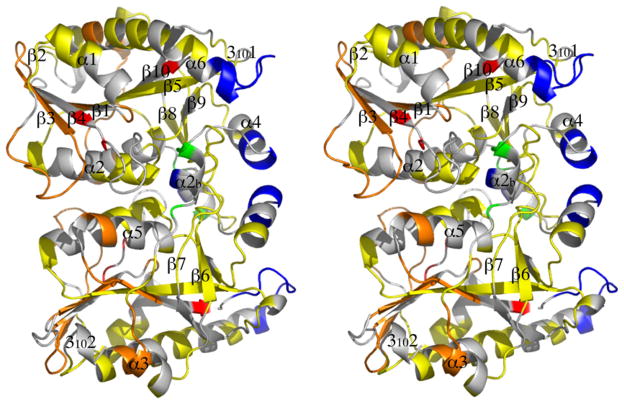
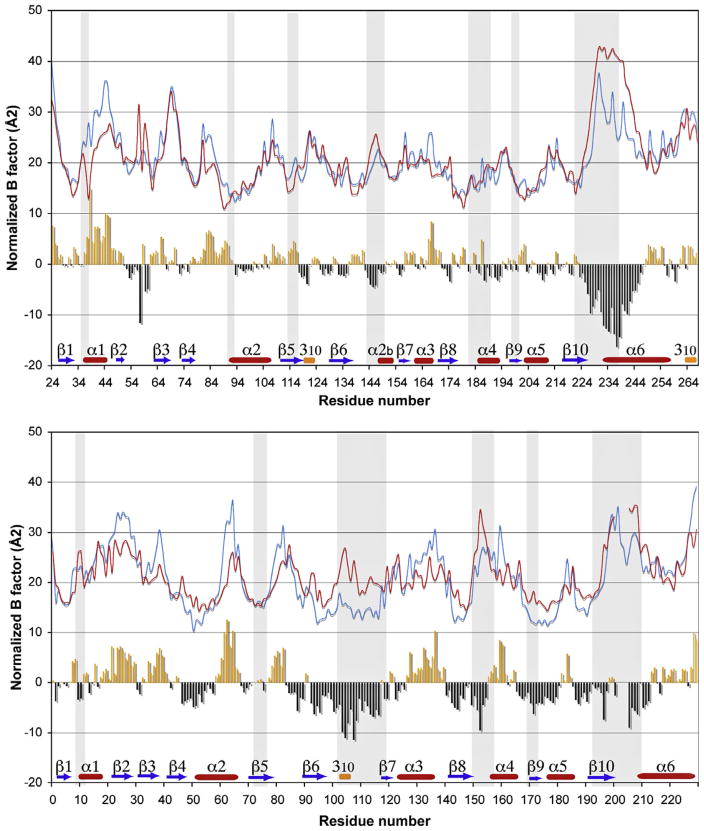
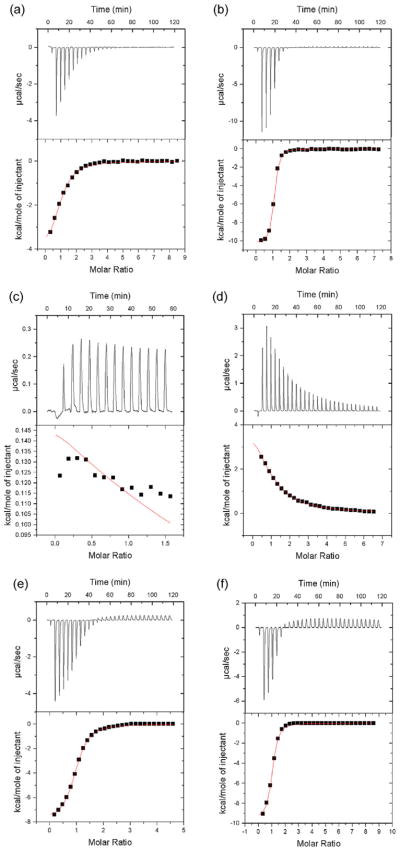
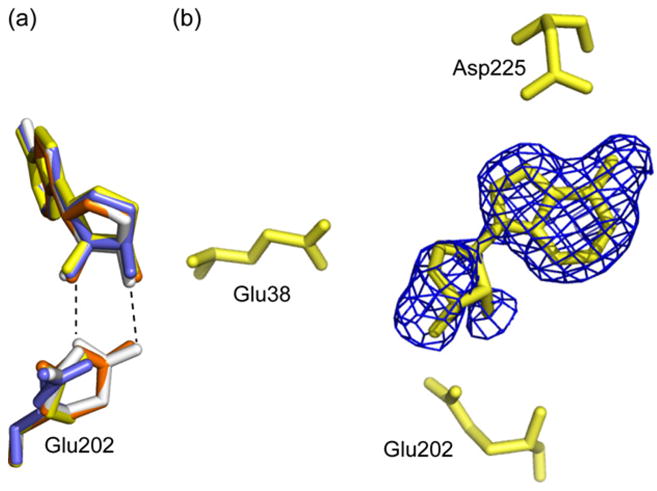
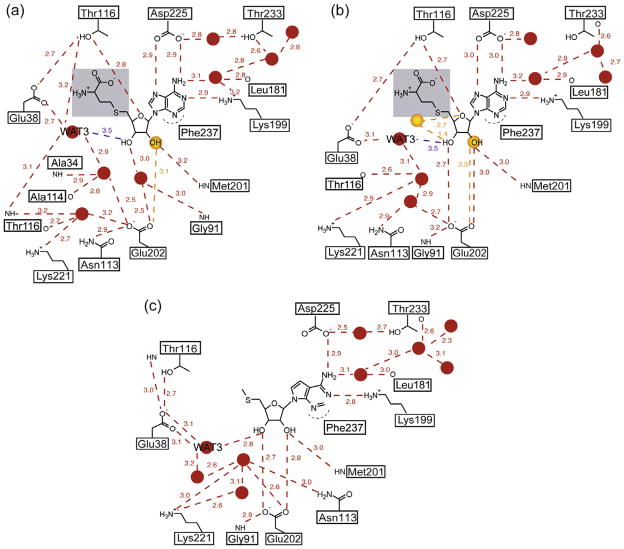
5'-Methylthioadenosine/S-adenosylhomocysteine (MTA/SAH) nucleosidase (MTAN) plays a key role in the methionine-recycling pathway of bacteria and plants. Despite extensive structural and biochemical studies, the molecular mechanism of substrate specificity for MTAN remains an outstanding question. Bacterial MTANs show comparable efficiency in hydrolyzing MTA and SAH, while the plant enzymes select preferentially for MTA, with either no or significantly reduced activity towards SAH. Bacterial and plant MTANs show significant conservation in the overall structure, and the adenine- and ribose-binding sites. The observation of a more constricted 5'-alkylthio binding site in Arabidopsis thalianaAtMTAN1 and AtMTAN2, two plant MTAN homologues, led to the hypothesis that steric hindrance may play a role in substrate selection in plant MTANs. We show using isothermal titration calorimetry that SAH binds to both Escherichia coli MTAN (EcMTAN) and AtMTAN1 with comparable micromolar affinity. To understand why AtMTAN1 can bind but not hydrolyze SAH, we determined the structure of the protein-SAH complex at 2.2Å resolution. The lack of catalytic activity appears to be related to the enzyme's inability to bind the substrate in a catalytically competent manner. The role of dynamics in substrate selection was also examined by probing the amide proton exchange rates of EcMTAN and AtMTAN1 via deuterium-hydrogen exchange coupled mass spectrometry. These results correlate with the B factors of available structures and the thermodynamic parameters associated with substrate binding, and suggest a higher level of conformational flexibility in the active site of EcMTAN. Our results implicate dynamics as an important factor in substrate selection in MTAN.
Copyright © 2010 Elsevier Inc. All rights reserved.
Figures
Similar articles
-
Molecular determinants of substrate specificity in plant 5'-methylthioadenosine nucleosidases.J Mol Biol. 2008 Apr 18;378(1):112-28. doi: 10.1016/j.jmb.2008.01.088. Epub 2008 Feb 8. J Mol Biol. 2008. PMID: 18342331 Free PMC article.
-
Substrate preference of 5'-methylthioadenosine/S-adenosylhomocysteine nucleosidase in Burkholderia thailandensis.FEMS Microbiol Lett. 2013 Feb;339(2):110-6. doi: 10.1111/1574-6968.12059. FEMS Microbiol Lett. 2013. PMID: 23198993
-
Biochemical and structural characterization of 5'-methylthioadenosine nucleosidases from Arabidopsis thaliana.Biochem Biophys Res Commun. 2009 Apr 17;381(4):619-24. doi: 10.1016/j.bbrc.2009.02.106. Epub 2009 Feb 26. Biochem Biophys Res Commun. 2009. PMID: 19249293
-
Methylthioadenosine/S-adenosylhomocysteine nucleosidase, a critical enzyme for bacterial metabolism.Mol Microbiol. 2011 Jan;79(1):7-20. doi: 10.1111/j.1365-2958.2010.07455.x. Epub 2010 Nov 18. Mol Microbiol. 2011. PMID: 21166890 Free PMC article. Review.
-
Methylthioadenosine.Int J Biochem Cell Biol. 2004 Nov;36(11):2125-30. doi: 10.1016/j.biocel.2003.11.016. Int J Biochem Cell Biol. 2004. PMID: 15313459 Review.
Cited by
-
Mechanisms of Copper Toxicity and Tolerance in the Aquatic Moss Taxiphyllum barbieri.Plants (Basel). 2023 Oct 18;12(20):3607. doi: 10.3390/plants12203607. Plants (Basel). 2023. PMID: 37896070 Free PMC article.
-
Crystal structures of the Helicobacter pylori MTAN enzyme reveal specific interactions between S-adenosylhomocysteine and the 5'-alkylthio binding subsite.Biochemistry. 2012 Dec 4;51(48):9763-72. doi: 10.1021/bi301221k. Epub 2012 Nov 20. Biochemistry. 2012. PMID: 23148563 Free PMC article.
-
Identification of immucillin analogue natural compounds to inhibit Helicobacter pylori MTAN through high throughput virtual screening and molecular dynamics simulation.In Silico Pharmacol. 2021 Mar 11;9(1):22. doi: 10.1007/s40203-021-00081-2. eCollection 2021. In Silico Pharmacol. 2021. PMID: 33786292 Free PMC article.
-
Recycling of methylthioadenosine is essential for normal vascular development and reproduction in Arabidopsis.Plant Physiol. 2012 Apr;158(4):1728-44. doi: 10.1104/pp.111.191072. Epub 2012 Feb 16. Plant Physiol. 2012. PMID: 22345506 Free PMC article.
-
Pseudomonas syringae type III effector HopAF1 suppresses plant immunity by targeting methionine recycling to block ethylene induction.Proc Natl Acad Sci U S A. 2016 Jun 21;113(25):E3577-86. doi: 10.1073/pnas.1606322113. Epub 2016 Jun 6. Proc Natl Acad Sci U S A. 2016. PMID: 27274076 Free PMC article.
References
-
- Baur AH, Yang SF. Methionine metabolism in apple tissue in relation to ethylene biosynthesis. Phytochemistry. 1972;11:3207–3214.
-
- Baxter C, Coscia CJ. In vitro synthesis of spermidine in the higher plant, Vinca rosea. Biochem Biophys Res Commun. 1973;54:147–154. - PubMed
-
- Black BE, Foltz DR, Chakravarthy S, Luger K, Woods VL, Jr, Cleveland DW. Structural determinants for generating centromeric chromatin. Nature. 2004;430:578–582. - PubMed
-
- Blessing R. Data reduction and error analysis for accurate single crystal diffraction intensities. Crystallog Rev. 1987:3–58.
Publication types
MeSH terms
Substances
Grants and funding
- R01 AI081982/AI/NIAID NIH HHS/United States
- CA099835/CA/NCI NIH HHS/United States
- R01 GM020501/GM/NIGMS NIH HHS/United States
- S10 RR029388/RR/NCRR NIH HHS/United States
- R21 AI076961/AI/NIAID NIH HHS/United States
- GM020501/GM/NIGMS NIH HHS/United States
- #43998/CAPMC/ CIHR/Canada
- R33 CA099835/CA/NCI NIH HHS/United States
- 43998/CAPMC/ CIHR/Canada
- AI076961/AI/NIAID NIH HHS/United States
- CA118595/CA/NCI NIH HHS/United States
- R21 CA099835/CA/NCI NIH HHS/United States
- AI081982/AI/NIAID NIH HHS/United States
- R21 CA118595/CA/NCI NIH HHS/United States
- F32 GM020501/GM/NIGMS NIH HHS/United States
- GM066170/GM/NIGMS NIH HHS/United States
- AI2008031/AI/NIAID NIH HHS/United States
- RR029388/RR/NCRR NIH HHS/United States
- R01 GM066170/GM/NIGMS NIH HHS/United States
- 46769/CAPMC/ CIHR/Canada
LinkOut - more resources
Full Text Sources
Molecular Biology Databases
