. 2010 Apr 8;15(4):152-61.
doi: 10.1186/2047-783x-15-4-152.

Enhanced effect of soluble transforming growth factor-beta receptor II and IFN-gamma fusion protein in reversing hepatic fibrosis

Affiliations

Enhanced effect of soluble transforming growth factor-beta receptor II and IFN-gamma fusion protein in reversing hepatic fibrosis

H Yao et al. Eur J Med Res. .

Abstract

Objective: To examine the in vivo anti-fibrotic effect of rat soluble transforming growth factor beta receptor II (RsTbetaRII) and IFN-gamma fusion protein (RsTbRII-IFN-gamma) in rat hepatic fibrosis model.

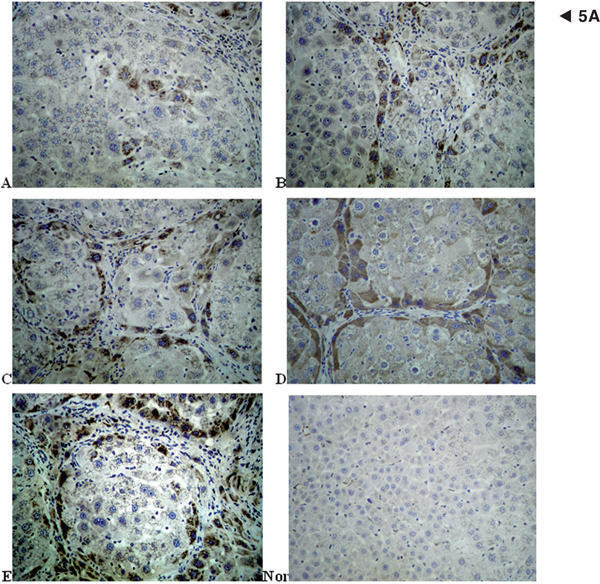
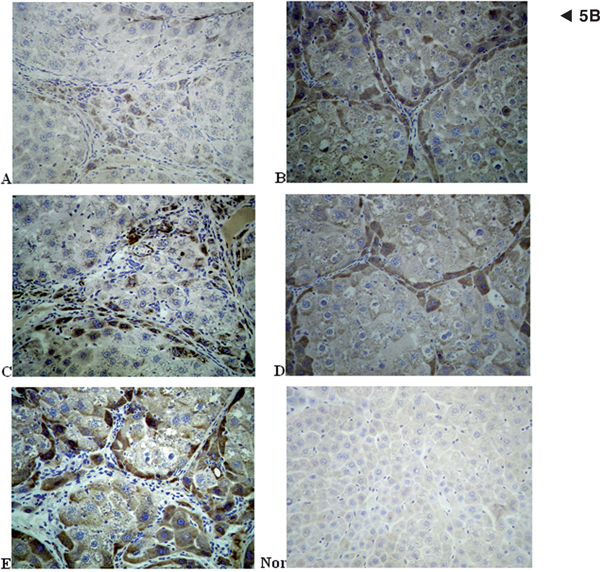
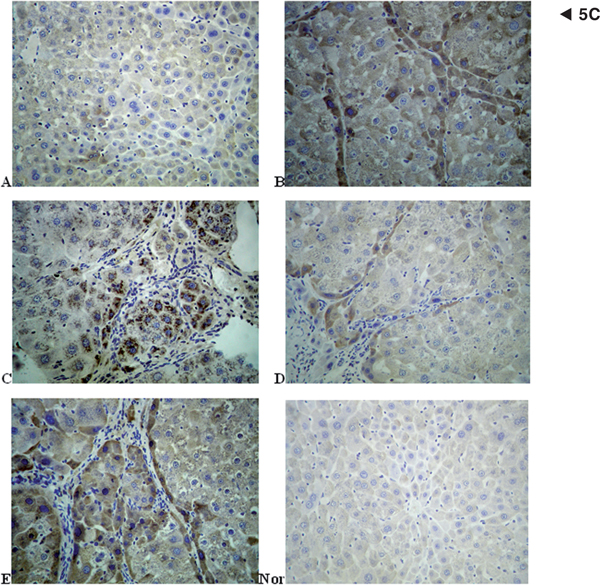
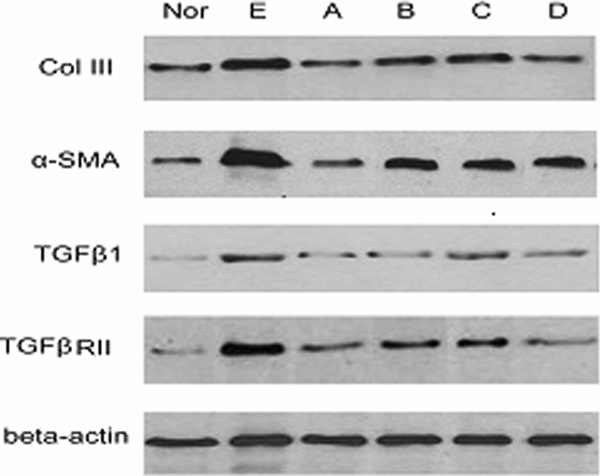
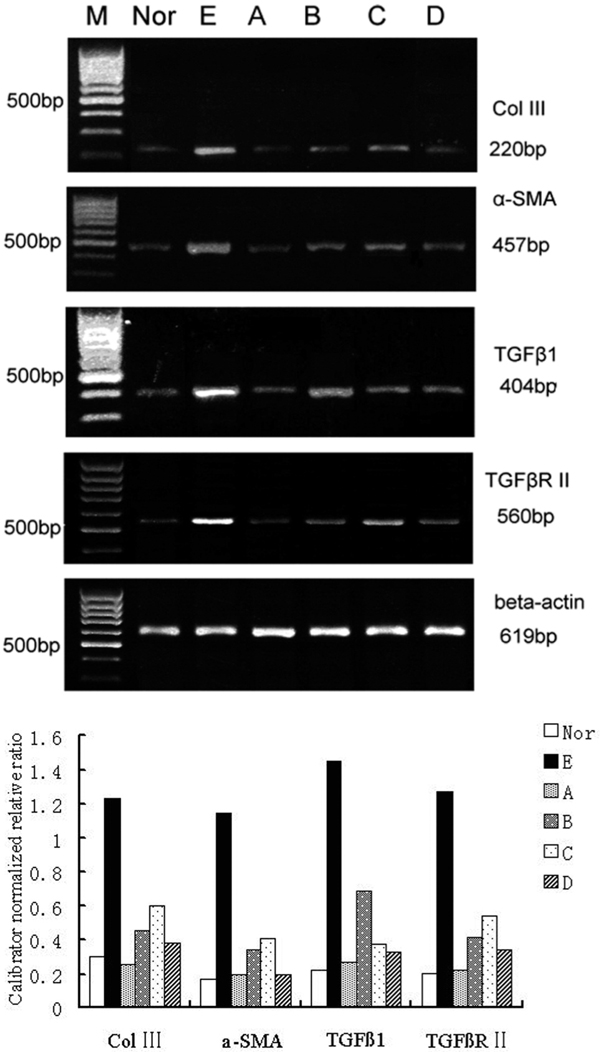
Methods: Model rats were divided into five groups and treated i.m. for 8 weeks: 1) fibrotic model group (each rat, 100 microl of 0.9% NaCl day superset-1); 2) RsTbetaRII-IFN-gamma treatment group (each rat, 0.136 mg x day(-1); 3) IFN-gamma treatment group (each rat, 7.5 MU x day(-1); 4) RsTbetaRII treatment group (each rat, 0.048 mg x day(-1); and 5) mixture of IFN-gamma and RsTbetaRII treatment group (each rat, IFN-gamma 7.5 MU x day(-1)+ RsTbetaRII 0.048 mg x day(-1). After treatment, hepatic fibrogenesis was evaluated by histopathological analysis and measurement of collagen III, alpha-smooth muscle actin (alpha-SMA), TGF-beta1, TGF-betaRII and their mRNA.

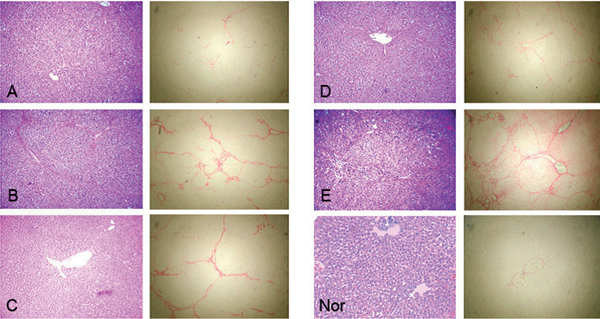
Results: Immunohistochemistry, Western blot and real-time RT-PCR showed that RsTbetaRII-IFN-gamma treatment significantly inhibited liver expression of collagen III, alpha-SMA, TGF-beta1 and TGF-betaRII at both protein and mRNA levels. Histopathological analysis also showed that the enhanced anti-fibrotic effects were achieved in model rats treated with RsTbetaRII-IFN-gamma.

Conclusion: Our results confirmed that RsTbetaRII-IFN-gamma has the enhanced effects in reversing hepatic fibrosis.


Figures

Figure 1
Figure 1
RsTβRII-IFN-γ dose-dependently protects L929 cells from infection of VSV. 1 × 10⁴/well L929 cells were added into a 96-well plate. Serial dilutions of RsTβRII-IFN-γ fusion protein were added into the assay plate except for the normal and viral controls after the cells adhered to wells. 3 hours later, 25 μl of VSV was added into each well except for the normal controls. The cells were incubated for 24 hours totally and 10 μl MTT (5 mg/ml) were added into each well 4 hours before the end of the culture. The cells were lysed in 150 μl DMSO. The absorbance at 540 nm was measured and percent protection of L929 from infection of VSV was calculated. Each assay was carried out in triplicate. 1: original RsTβRIFN-γ fusion protein; 2~10: 2 × serial dilutions of 1; VSV Control: L929 challenged by VSV.
Figure 2
Figure 2
RsTβRII-IFN-γ fusion protein blocks the inhibitory effect of TGF-β1 on CCL-64 cell proliferation. Serial dilutions of RsTβRII-IFN-γ fusion protein were incubated with 800 pg/ml TGF-β1 for one hour in assay medium in a 96-well plate. 1 × 10⁴ cells of CCL-64 per well were added into each well. The cells were incubated at 37°C for 72 hours and 10 μl MTT (5 mg/ml) were added into each well 4 hours before the end of the culture. The cells were lysed in 150 μl DMSO. The absorbance at 540 nm was measured. Each assay was carried out in triplicate. Mv1Lu: Untreated CCL-64 cells. 1: Original purified RsTβRII-IFN-γ fusion protein; 2~6: 2 × serial dilutions of 1; TGF-β1: CCL-64 cells treated with TGF-β1 without RsTβRII-IFN-γ fusion protein.
Figure 3
Figure 3
RsTβRII blocks the growth-inhibitory effect of TGFβ1 on CCL-64 cells. Serial dilutions of RsTβRII were incubated with 800 pg/ml TGF-β1 for one hour in assay medium in a 96-well plate. 1 × 10⁴ cells of CCL-64 per well were added into each well. The cells were incubated at 37°C for 72 hours and 10 μl MTT (5 mg/ml) were added into each well 4 hours before the end of the culture. The cells were lysed in 150 μl DMSO and the absorbance at 540 nm was measured and ratios of inhibition were calculated. Mv1Lu: Untreated CCL-64 cells; 1: Original purified RsTβR protein; TGF-β1: CCL-64 cells treated with TGF-β1 but without RsTβRII protein.
Figure 4
Figure 4
Histopathological analyses of livers in rats from different groups. 4 weeks after the finish of treatment, rats with hepatic fibrosis in each group were killed and livers were harvested, fixed in 10% neutral formalin, sectioned, and stained with hematoxylin-eosin (left column) and Sirius red (right column) respectively. Representative micrograph in each group was shown (original magnification ×200). A, RsTβRII-IFN-γ fusion protein treatment group; B, IFN-γ treatment group; C, RsTβRII treatment group; D, mixture of IFN-γ and RsTβRII treatment group; E, fibrotic model group; Nor, normal control group.
Figure 5A
Figure 5A
Immunohistochemistry of α-SMA, Col III, TGF-β1. Paraffin sections of liver were incubated overnight at 4°C with anti-α-SMA (Figure. 5A), anti-type III collagen (Figure. 5B), anti-TGF-β1 (Figure. 5C) monoclonal antibodies (1:100 dilutions). This was followed by incubation in biotinylated goat anti-mouse antibodies (1:200 dilutions) for 40 min and treated with SABC for 30 min at 37°C. The peroxidase activity, which resulted in a brown staining of cytoplasmic reaction sites, was visualized by incubation for 30 sec~1 min in dimethylbenzidine and staining lightly with hematoxylin.
Figure 5B
Figure 5B
Immunohistochemistry of α-SMA, Col III, TGF-β1. Paraffin sections of liver were incubated overnight at 4°C with anti-α-SMA (Figure. 5A), anti-type III collagen (Figure. 5B), anti-TGF-β1 (Figure. 5C) monoclonal antibodies (1:100 dilutions). This was followed by incubation in biotinylated goat anti-mouse antibodies (1:200 dilutions) for 40 min and treated with SABC for 30 min at 37°C. The peroxidase activity, which resulted in a brown staining of cytoplasmic reaction sites, was visualized by incubation for 30 sec~1 min in dimethylbenzidine and staining lightly with hematoxylin.
Figure 5C
Figure 5C
Immunohistochemistry of α-SMA, Col III, TGF-β1. Paraffin sections of liver were incubated overnight at 4°C with anti-α-SMA (Figure. 5A), anti-type III collagen (Figure. 5B), anti-TGF-β1 (Figure. 5C) monoclonal antibodies (1:100 dilutions). This was followed by incubation in biotinylated goat anti-mouse antibodies (1:200 dilutions) for 40 min and treated with SABC for 30 min at 37°C. The peroxidase activity, which resulted in a brown staining of cytoplasmic reaction sites, was visualized by incubation for 30 sec~1 min in dimethylbenzidine and staining lightly with hematoxylin.
Figure 6
Figure 6
Western blotting analysis of Col III, α-SMA, TGF-β1 and TGF-βRII. Liver tissues from rats in different groups were lysed in the lysis buffer. Samples were centrifuged to pellet cell debris, mixed with SDS-PAGE sample buffer. After boiled for 5~10 min, 40 μg of protein was electrophoresed on a 10% SDS-polyacrylamide gel. The protein was transferred to PVDF membrane. The blots were incubated with the primary antibody against Col III, α-SMA, TGF-β1, TGF-βRII and β-actin (1: 400) at 4°C overnight respectively and subsequently with corresponding secondary antibody (1: 1000) at room temperature for 2 h. Protein bands were visualized with an ECL Western blotting detection system kit and signal was captured on X-ray film.
Figure 7
Figure 7
Real-time RT-PCR for Col III, α-SMA, TGF-β1 and TGF-βRII mRNA expression. Total RNA was isolated from frozen liver tissues. Real-time RT-PCR was performed using Light Cycler FastStart SYBR Green I Master according to the manufacturer's instructions. (A) Gel electrophoresis of PCR products. (B) Calibrator normalized relative ratios. A: RsTβRII-IFN-γ fusion protein treatment group; B: IFN-γ treatment group; C: RsTβRII protein treatment group; D: mixture of RIFN-γ and RsTβRII treatment group; E: fibrotic model group; Nor: normal control group.

Similar articles

References

    1. Maher JJ, McGuire RF. Extracellular matrix gene expression increases preferentially in rat lipocytes and sinusoidal endothelial cells during hepatic fibrosis in vivo. J Clin Invest. 1990;86(5):1641–1648. doi: 10.1172/JCI114886. - DOI - PMC - PubMed
    1. Hsu YC, Chiu YT, Cheng CC, Wu CF, Lin YL, Huang YT. Antifibrotic effects of tetrandrine on hepatic stellate cells and rats with liver fibrosis. J Gastroenterol Hepatol. 2007;22(1):99–111. doi: 10.1111/j.1440-1746.2006.04361.x. - DOI - PubMed
    1. Bissell DM, Wang SS, Jarnagin WR, Roll FJ. Cell-specific expression of transforming growth factor-beta in rat liver. Evidence for autocrine regulation of hepatocyte proliferation. J Clin Invest. 1995;96(1):447–455. doi: 10.1172/JCI118055. - DOI - PMC - PubMed
    1. Border WA, Ruoslahti E. Transforming growth factor-beta in disease: the dark side of tissue repair. J Clin Invest. 1992;90(1):1–7. doi: 10.1172/JCI115821. - DOI - PMC - PubMed
    1. Border WA, Noble NA. Transforming growth factor β in tissue fibrosis. N Eng J Med. 1994;331(19):1286–1292. doi: 10.1056/NEJM199411103311907. - DOI - PubMed

Publication types

MeSH terms

Substances