. 2010 Aug 20;285(34):26279-88.
doi: 10.1074/jbc.M110.134775. Epub 2010 Jun 16.

Exosome secretion ameliorates lysosomal storage of cholesterol in Niemann-Pick type C disease

Affiliations

Exosome secretion ameliorates lysosomal storage of cholesterol in Niemann-Pick type C disease

Katrin Strauss et al. J Biol Chem. .

Abstract

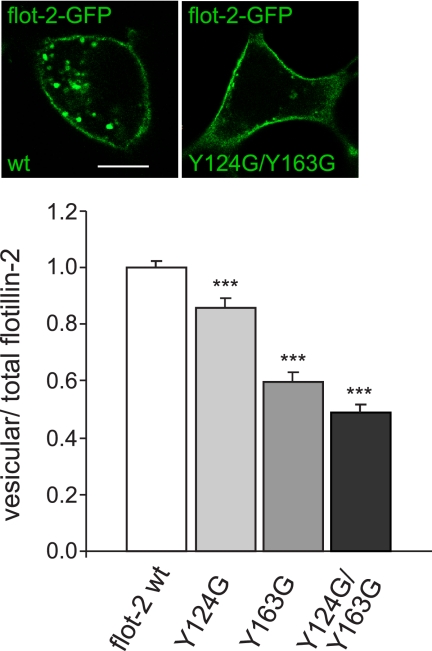
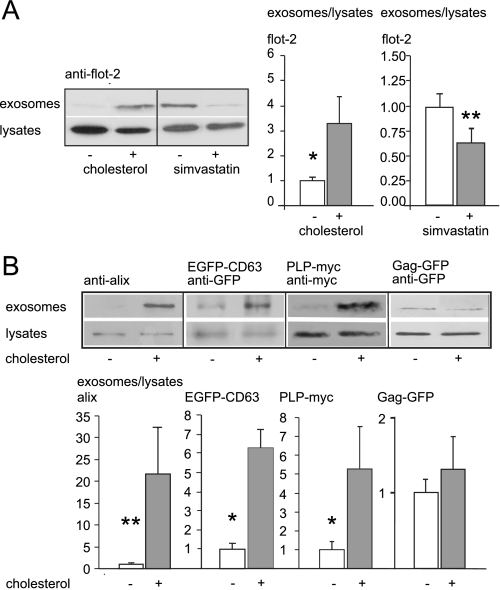
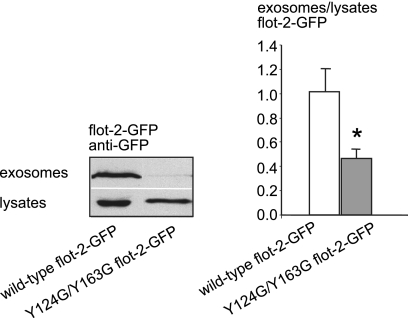
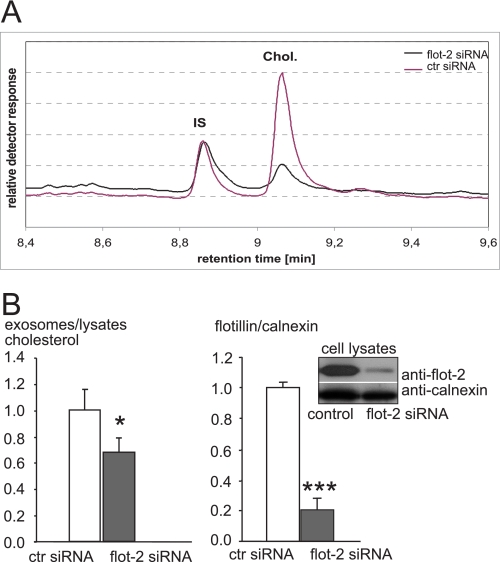
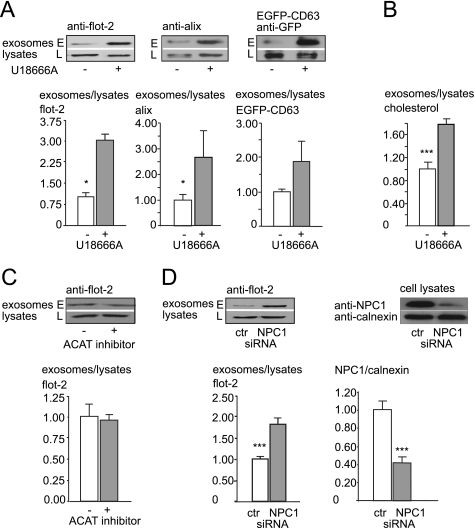
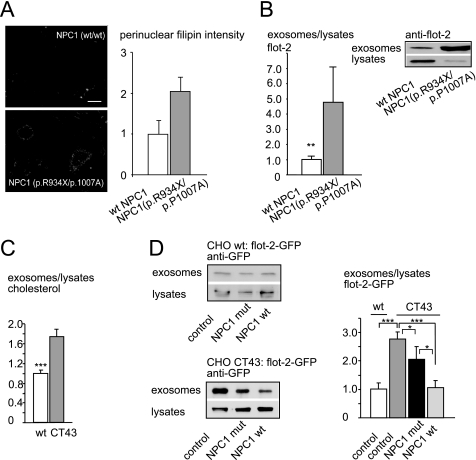
Niemann-Pick type C1 disease is an autosomal-recessive lysosomal storage disorder. Loss of function of the npc1 gene leads to abnormal accumulation of free cholesterol and sphingolipids within the late endosomal and lysosomal compartments resulting in progressive neurodegeneration and dysmyelination. Here, we show that oligodendroglial cells secrete cholesterol by exosomes when challenged with cholesterol or U18666A, which induces late endosomal cholesterol accumulation. Up-regulation of exosomal cholesterol release was also observed after siRNA-mediated knockdown of NPC1 and in fibroblasts derived from NPC1 patients and could be reversed by expression of wild-type NPC1. We provide evidence that exosomal cholesterol secretion depends on the presence of flotillin. Our findings indicate that exosomal release of cholesterol may serve as a cellular mechanism to partially bypass the traffic block that results in the toxic lysosomal cholesterol accumulation in Niemann-Pick type C1 disease. Furthermore, we suggest that secretion of cholesterol by exosomes contributes to maintain cellular cholesterol homeostasis.


Figures

FIGURE 1.
FIGURE 1.
The CRAC domains of flotillin-2 (flot-2) are required for intracellular vesicular localization of the protein. Flot-2-GFP wild type or flot-2-GFP bearing point mutations in one or two putative CRAC domains (Y124G, Y163G, and Y124G/Y163G) were transfected into Oli-neu cells (immunofluorescence, upper panel). The quantification of vesicular to total cellular flotillin-2-GFP (wild-type or mutants Y124G, Y163G, Y124G/Y163G) (histogram, lower panel) reflects the accumulation of CRAC mutants at the plasma membrane. Note that the double mutation of both CRAC domains Y124G/Y163G in flotillin-2-GFP (right) exerts the most pronounced effect compared with wild-type flot-2-GFP (left). Values are given as means ± S.E. from three independent experiments. *** indicates p < 0.0005. Scale bar, 10 μm.
FIGURE 2.
FIGURE 2.
Cholesterol enhances the release of flotillin-2-positive exosomes. A, Western blot and quantification of exosomal release after cholesterol loading of Oli-neu cells (left part of the blot, gray bar) or mock-treated control cells (white bar) are shown. Blots were scanned, and the ratio of endogenous flotillin-2 intensity in the exosomal fraction to flotillin-2 intensity in the cell lysates of exosome secreting parent cells was determined. Similarly, exosome release was determined after treatment of Oli-neu cells with simvastatin (right part of the blot, gray bar) compared with untreated controls (white bar). Values are given as the mean ± S.E. from n = 8 and n = 12 experiments. B, shown are Western blots (top panel) and quantification (bottom panel) of exosomal release of endogenous alix, transiently expressed EGFP-CD63, PLP-myc, and Gag-GFP after cholesterol loading (gray bars) or not (white bars, normalized to 1) in Oli-neu cells. Values are given as the mean ± S.E. from n = 6, 4, 5, and 12 experiments. Similar to flotillin-2, alix, EGFP-CD63, and PLP-myc immunoreactivity was increased in the 100,000 × g fraction after cholesterol treatment, whereas cholesterol has no significant impact on the release of Gag-GFP within exosome-like particles. *, p < 0.05; **, p < 0.005.
FIGURE 3.
FIGURE 3.
The CRAC domains of flotillin-2 are necessary for exosomal release of the protein. Shown are Western blot of lysates (lower panel) and exosome fractions (upper panel) from Oli-neu cells transfected with flotillin-2-GFP wild-type (left) and CRAC double mutant flotillin-2-GFP Y124G/Y163G (right). Blots were scanned, and the intensity of bands was quantified. The histogram shows the ratio of exosomal wild-type flotillin-2-GFP (white bar) and CRAC double mutant flotillin-2-GFP intensities (gray bar) to respective cell lysates after cholesterol loading of the cells. Controls were normalized to 1. Values are given as the mean ± S.E. from n = 13 experiments. * indicates p < 0.05.
FIGURE 4.
FIGURE 4.
Flotillin is required for exosomal release of cholesterol. Oli-neu cells were transfected with siRNA directed against flotillin-2 or with control siRNA. A, the organic phase was extracted from exosomal fractions and parent cell lysates and subjected to gas chromatography to quantify cholesterol contents. A typical retention profile is shown for exosome fractions from flotillin-2 knockdown cells (black) and control cells (lilac). IS, internal standard. B, the left histogram depicts the cholesterol ratio from exosomes versus parent cell lysates after siRNA-mediated down-regulation of flotillin-2 (gray bar) or from control (ctr) siRNA-transfected cells (white bar). Values of controls were normalized to 1, and all values are given as the mean ± S.E. from n = 5 experiments. * indicates p < 0.05. The right histogram and Western blot show siRNA-mediated down-regulation of flotillin-2. Cells were scraped into lysis buffer and subjected to Western blotting. Down-regulation of flotillin-2 was determined by probing the blot membrane with antibodies against flotillin-2 (upper lane) and calnexin (lower lane) as an internal standard. The ratio flotillin-2 to calnexin is shown for treatment with control siRNA (white bar) and flotillin-2 siRNA (gray bar). Values are given as the means ± S.E. for n = 9 experiments. *** indicates p < 0.0005. The knockdown efficiency was ∼80%.
FIGURE 5.
FIGURE 5.
Exosome release is up-regulated by pharmacological trapping of cholesterol in the late endosome or down-regulation of Niemann-Pick type C protein. A, shown is exosome release from Oli-neu cells treated with U18666A (gray bar) or not (white bar), determined as the ratio of endogenous flotillin-2 (left), alix (middle), and transiently transfected EGFP-CD63 (right) in the exosome fraction (E) versus corresponding cell lysates (L). B, a similar experiment as in A is shown. Cells were treated with U18666A or solvent only. Cholesterol contents of exosome fractions and cell lysates were determined by gas chromatography. The ratio of cholesterol in exosomes to parent cell lysates is shown for U18666A treated cells (gray bar) and controls (white bar). C, exosome release from Oli-neu cells untreated (white bar) or treated (gray bar) with acyl-coenzyme A:cholesterol acyltransferase (ACAT) inhibitor CP-113.818 is shown as a ratio of flotillin-2 in the exosomal fraction to corresponding cell lysates. D, exosome release from Oli-neu cells either treated with siRNA directed against NPC1 (gray bar) or control (ctl) siRNA (white bar) is shown. Flotillin-2 was used as marker protein for quantification of exosome release as ratio of flotillin-2 in the exosome fraction to corresponding cell lysates. The right histogram and Western blot shows siRNA-mediated down-regulation of NPC1. Cells were electroporated with control siRNA (left lane) or NPC1 directed-siRNA (right lane), and lysates were probed with an antibody recognizing endogenous NPC1 (upper panel of the Western blot). The same blot membrane was incubated with an antibody directed against calnexin (lower panel). Knockdown efficiency of NPC1-directed siRNA was calculated as the ratio of NPC1 to calnexin intensity of control siRNA (white bar)- or NPC1 siRNA (gray bar)-treated cells. Values are given as the means ± S.E. from n = 8 experiments with controls normalized to 1. *** indicates p < 0.0005.
FIGURE 6.
FIGURE 6.
Exosome secretion and exosomal cholesterol release are increased in Niemann-Pick type C disease. A, filipin staining of human skin fibroblast cultures of a patient positive for the R934X/P1007A mutation (bottom) and wild-type control (top) is shown. Images were acquired automatically on a wide-field microscope using 10× objective. Scale bar, 10 μm. Histogram: perinuclear filipin signal intensities (arbitrary units) from up 200 individual cells/cell line were acquired and quantified as described by Bartz et al. (18) with modifications for cultured fibroblasts (H. Runz, unpublished results). B, exosome secretion by fibroblasts from NPC1 patients positive for the R934X/P1007A mutation (gray bar) and healthy controls (white bar) is shown. Western blots, the upper two panels show exosome fractions and cell lysates of fibroblasts from a patient positive for the R934X/P1007A mutation (right) and a healthy control (left) probed with an antibody against flotillin-2. All values are given as the mean ± S.E. from at least nine experiments. C, histogram, the ratio of cholesterol from exosomes versus parent cell lysates is increased in the CHO CT43 cell line (right), which carries a truncation mutation in the NPC1 protein compared with wild-type control CHO cells (left). D, Western blot of exosomes and lysates prepared from either wild-type CHO cells (upper panel) or the CHO CT43 cell line (lower panel). Cell lines were transiently transfected with flotillin-2-GFP alone (left) or in combination with mutant NPC1 P692S (middle) or wild-type NPC1(right). Blots were probed with anti-GFP antibody, and the ratio of flotillin-2-GFP in the 100,000 × g pellet versus lysates was quantified (histograph, right). *, p < 0.05; **, p < 0.005; ***, p < 0.0005. mut, mutant.

References

    1. van Niel G., Porto-Carreiro I., Simoes S., Raposo G. (2006) J. Biochem. 140, 13–21 - PubMed
    1. Keller S., Sanderson M. P., Stoeck A., Altevogt P. (2006) Immunol. Lett. 107, 102–108 - PubMed
    1. Belting M., Wittrup A. (2008) J. Cell Biol. 183, 1187–1191 - PMC - PubMed
    1. Simons M., Raposo G. (2009) Curr. Opin Cell Biol. 21, 575–581 - PubMed
    1. Montecalvo A., Shufesky W. J., Stolz D. B., Sullivan M. G., Wang Z., Divito S. J., Papworth G. D., Watkins S. C., Robbins P. D., Larregina A. T., Morelli A. E. (2008) J. Immunol. 180, 3081–3090 - PubMed

Publication types

MeSH terms