. 2010 Nov 22;277(1699):3391-400.
doi: 10.1098/rspb.2010.0771. Epub 2010 Jun 16.

Phenotypic plasticity and population viability: the importance of environmental predictability

Affiliations

Phenotypic plasticity and population viability: the importance of environmental predictability

Thomas E Reed et al. Proc Biol Sci. .

Abstract

Phenotypic plasticity plays a key role in modulating how environmental variation influences population dynamics, but we have only rudimentary understanding of how plasticity interacts with the magnitude and predictability of environmental variation to affect population dynamics and persistence. We developed a stochastic individual-based model, in which phenotypes could respond to a temporally fluctuating environmental cue and fitness depended on the match between the phenotype and a randomly fluctuating trait optimum, to assess the absolute fitness and population dynamic consequences of plasticity under different levels of environmental stochasticity and cue reliability. When cue and optimum were tightly correlated, plasticity buffered absolute fitness from environmental variability, and population size remained high and relatively invariant. In contrast, when this correlation weakened and environmental variability was high, strong plasticity reduced population size, and populations with excessively strong plasticity had substantially greater extinction probability. Given that environments might become more variable and unpredictable in the future owing to anthropogenic influences, reaction norms that evolved under historic selective regimes could imperil populations in novel or changing environmental contexts. We suggest that demographic models (e.g. population viability analyses) would benefit from a more explicit consideration of how phenotypic plasticity influences population responses to environmental change.


Figures
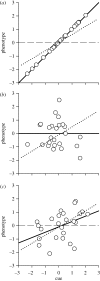
Figure 1.
Figure 1.
Illustration of three different scenarios of environmental predictability (simulated data). In each panel, phenotypic optima are plotted against cue values, simulated by drawing each from a standard bivariate normal distribution (means of 0 and standard deviations of 1), with a different correlation between the cue and the optimum in each panel. The optimal reaction norm in each case is shown as a solid black line, and the reaction norms of two individuals are also shown: a non-plastic genotype that produces the same phenotype in every environment (dashed line), and a plastic genotype (dotted line; slope = 0.5). (a) The correlation between the cue and the optimum is perfect (r = 1), so the optimal reaction norm has a slope of 1 and intercept of 0. The plastic genotype has higher average expected fitness than the fixed genotype (the fitness of a genotype is maximized by minimizing the sum of squared deviations between environment-specific phenotypes and corresponding optimal phenotypes). (b) The cue and the optimum are completely decoupled (r = 0), so the optimal reaction norm has a slope of 0 as well as an intercept of 0. The fixed genotype has higher expected fitness than the plastic genotype under these circumstances. (c) The cue and the optimum are 40 per cent correlated, so the optimal reaction norm has a slope of 0.4. The plastic genotype has a slope closer to the optimum slope, and consequently higher fitness, than a non-plastic genotype.
Figure 2.
Figure 2.
Average absolute deviation (mismatch) per generation (calculated across 150 generations) between the observed mean phenotype and the optimum phenotype, plotted as a function of cue reliability. The y-axis units are phenotypic standard deviations. Environmental stochasticity was fixed at 5 units. Different colours represent different reaction norm slopes (black = no plasticity, pink = slope of 0.11, blue = slope of 0.33, red = slope of 0.66, green = slope of 0.99; see main text for explanation of units).
Figure 3.
Figure 3.
Effects of plasticity on population dynamics as a function of cue reliability (correlation between cue and environmental optimum). The magnitude of environmental stochasticity was fixed at 3 units (see main text for explanation), and cue reliability was fixed at either (a,c) 0.2 or (b,d) 0.8. In each panel, temporal fluctuations in the abundance of four randomly chosen replicate populations are shown. (a,b) Trends for populations with no plasticity (flat reaction norms); (c,d) trends for populations with strongly positive reaction norm slopes (here, β = 0.99).
Figure 4.
Figure 4.
The proportion of replicate populations (out of a total of 500) that went extinct within 150 generations, plotted against cue reliability. The panels show outcomes for different magnitudes of environmental stochasticity (variance in the cue and the optimum; see main text for explanation), and different colour curves represent different strengths of plasticity (as indexed by β, the reaction norm slope; black: β = 0, pink: β = 0.11, blue: β = 0.33, red: β = 0.66, green: β = 0.99). (a) Stochasticity = 1; (b) stochasticity = 3; (c) stochasticity = 5; (d) stochasticity = 7; (e) stochasticity = 9; (f) stochasticity = 11.
Figure 5.
Figure 5.
Minimum plasticity (slope of reaction norm) required for persistence, as a function of cue reliability and environmental stochasticity. The panels show outcomes for six different magnitudes of environmental stochasticity. Three levels of quasi-persistence are depicted in each panel: 50% (darkest shade of grey; ≥50% of replicate populations persisted), 75% (intermediate shade of grey; >75% of replicate populations persisted) and 95% (lightest shade of grey; >95% of replicate populations persisted). Black areas are regions of parameter space where >50% of replicate populations went extinct. (a) Stochasticity = 1; (b) stochasticity = 3; (c) stochasticity = 5; (d) stochasticity = 7; (e) stochasticity = 9; (f) stochasticity = 11.

Similar articles

Cited by

References

    1. Both C., Bouwhuis S., Lessells C. M., Visser M. E.2006Climate change and population declines in a long-distance migratory bird. Nature 441, 81–83 (doi:10.1038/nature04539) - DOI - PubMed
    1. Bradshaw A. D.1965Evolutionary significance of phenotypic plasticity in plants. Adv. Genet. 13, 115–155
    1. Bradshaw W. E.1986Pervasive themes in insect life cycle strategies. In The evolution of insect life cycles (eds Taylor F., Karban R.). London, UK: Springer-Verlag
    1. Caswell H.1983Phenotypic plasticity in life-history traits—demographic effects and evolutionary consequences. Am. Zool. 23, 35–46
    1. Chevin L. M., Lande R.2010When do adaptive plasticity and genetic evolution prevent extinction of a density-regulated population? Evolution 64, 1143–1150 (doi:10.1111/j.1558-5646.2009.00875.x) - DOI - PubMed

Publication types

LinkOut - more resources