. 2010 Nov;51(11):5789-95.
doi: 10.1167/iovs.10-5633. Epub 2010 Jun 16.

Retinal structure of birds of prey revealed by ultra-high resolution spectral-domain optical coherence tomography

Affiliations

Retinal structure of birds of prey revealed by ultra-high resolution spectral-domain optical coherence tomography

Marco Ruggeri et al. Invest Ophthalmol Vis Sci. 2010 Nov.

Abstract

Purpose: To reveal three-dimensional (3-D) information about the retinal structures of birds of prey in vivo.

Methods: An ultra-high resolution spectral-domain optical coherence tomography (SD-OCT) system was built for in vivo imaging of retinas of birds of prey. The calibrated imaging depth and axial resolution of the system were 3.1 mm and 2.8 μm (in tissue), respectively. 3-D segmentation was performed for calculation of the retinal nerve fiber layer (RNFL) map.

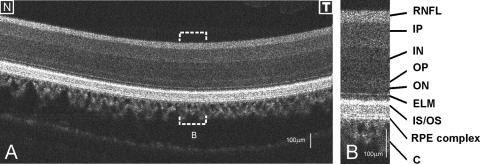
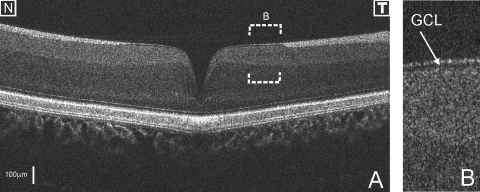
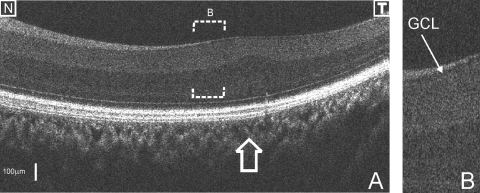
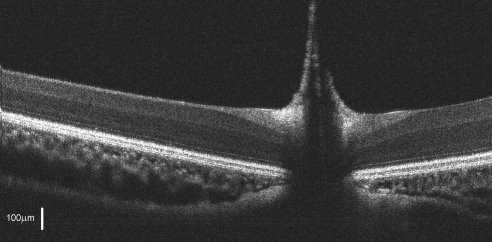
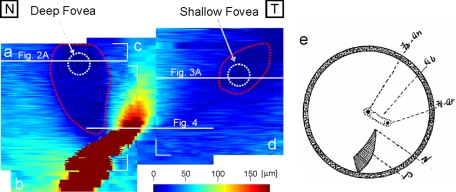
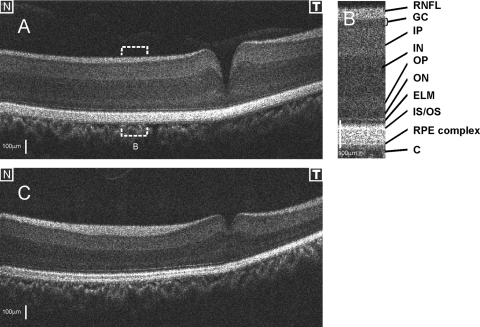
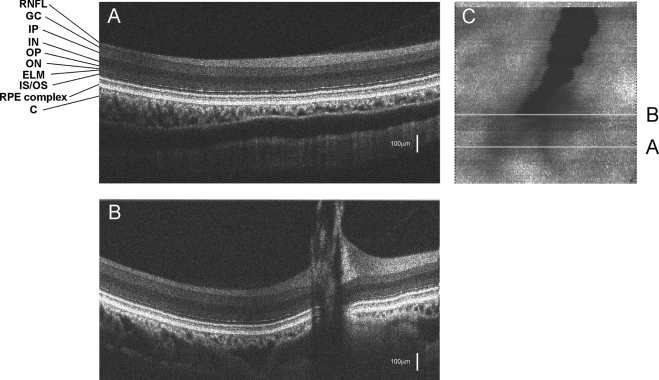
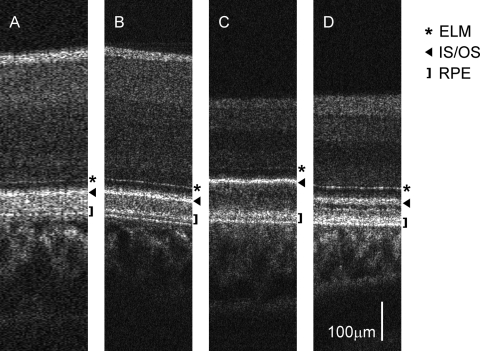
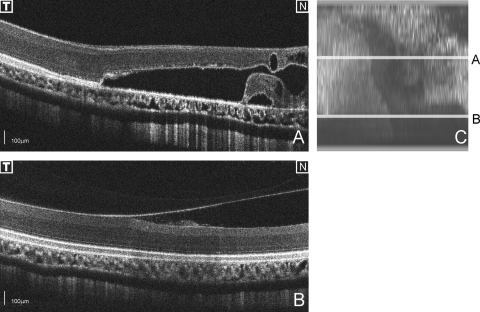
Results: High-resolution OCT images were obtained of the retinas of four species of birds of prey: two diurnal hawks (Buteo platypterus and Buteo brachyurus) and two nocturnal owls (Bubo virginianus and Strix varia). These images showed the detailed retinal anatomy, including the retinal layers and the structure of the deep and shallow foveae. The calculated thickness map showed the RNFL distribution. Traumatic injury to one bird's retina was also successfully imaged.

Conclusions: Ultra-high resolution SD-OCT provides unprecedented high-quality 2-D and 3-D in vivo visualization of the retinal structures of birds of prey. SD-OCT is a powerful imaging tool for vision research in birds of prey.


Figures

Figure 1.
Figure 1.
(A) OCT image of the left eye of a broad-winged hawk retina. (B) Magnification (×2) of the bracketed area in (A). The retinal structures are labeled from the top to the bottom as retinal nerve fiber layer (RNFL), inner plexiform layer (IP), inner nuclear layer (IN), outer plexiform layer (OP), outer nuclear layer (ON), external limiting membrane (ELM), junction between the inner and outer segment layers of the photoreceptors (IS/OS), the RPE complex, and the choroid (C).
Figure 2.
Figure 2.
(A) OCT image of the retina crossing the deep fovea of the left eye of a broad-winged hawk. The image consists of 2048 A-lines. (B) Enlarged view of the area marked in (A) and the GCL (arrow). Magnification, ×4.
Figure 3.
Figure 3.
(A) OCT image of the retina crossing the shallow fovea of the left eye of a broad-winged hawk. Arrow: thicker photoreceptor OS in the fovea. The image consists of 512 A-lines. (B) Enlarged view of the area marked in (A) and the GCL (arrow).
Figure 4.
Figure 4.
OCT image crossing the pecten at the ONH of the left eye of a broad-winged hawk. The image consists of 2048 A-lines. The pecten protrudes into the vitreous, as expected.
Figure 5.
Figure 5.
(ad) Composite RNFL thickness map of the broad-winged hawk retina. Red dashed lines: the approximate margins of areas with a thicker GCL. The datasets corresponding to the thickness maps in (a) and (d) consist of 512 × 128 A-lines, whereas the datasets corresponding to the thickness maps in (b) and (c) consist of 2048 × 32 A-lines. Horizontal white lines: the locations of the OCT images in Figures 2A, 3A, and 4. (e) Diagram of the fundus of the red-tailed hawk (Buteo borealis). N, optic nerve entrance; P, pecten; Ft, temporal fovea (shallow fovea); Fn, nasal fovea (deep fovea).
Figure 6.
Figure 6.
OCT images of a short-tailed hawk retina in the right eye. (A) The deep fovea; (B) twofold magnification of area marked in (A). The retinal anatomic structures were labeled as in Figure 1, including the GCL (GC). (C) shallow fovea. The OCT images consist of 512 A-lines.
Figure 7.
Figure 7.
(A) OCT image of a barred owl retina. (B) OCT image of the retina crossing the pecten. (C) OCT fundus images that show the relative locations of images (A) and (B). The OCT images in (A) and (B) consist of 512 A-lines.
Figure 8.
Figure 8.
Comparison of the enlarged OCT images of the retina among the short-tailed hawk (A), broad-winged hawk (B), great horned owl (C), and barred owl (D). Images (A) and (B) are close to the deep fovea. Images (C) and (D) are close to the base of the pecten. Image (A) consists of 40 A-lines, and images (BD) consist of 160 A-lines.
Figure 9.
Figure 9.
(A, B) OCT images of the retina of a broad-winged hawk's right eye that show traumatic retinal injury. (C) OCT fundus image in which the spatial location of the images (A) and (B) are marked.

References

    1. Walls GL. The Vertebrate Eye and Its Adaptive Radiation. Bloomfield Hills: Crankbook Institute of Science; 1963
    1. Jones MP, Pierce KE, Jr, Ward D. Avian vision: a review of form and function with special consideration to birds of prey. J Exotic Pet Med. 2007;16(2):69–87
    1. Fite KV. Anatomical and behavioral correlates of visual acuity in the great horned owl. Vision Res. 1973;13:219–230 - PubMed
    1. Butler AB, Hodos W. Comparative Vertebrate Neuroanatomy: Evolution and Adaptation. New York; Wiley-Liss; 1996
    1. Curcio CA, Allen KA. Topography of ganglion cells in human retina. J Comp Neurol. 1990;300:5–25 - PubMed

Publication types

MeSH terms