. 2010 Aug 15;21(16):2844-59.
doi: 10.1091/mbc.E10-02-0131. Epub 2010 Jun 16.

Plakophilin 2 couples actomyosin remodeling to desmosomal plaque assembly via RhoA

Affiliations

Plakophilin 2 couples actomyosin remodeling to desmosomal plaque assembly via RhoA

Lisa M Godsel et al. Mol Biol Cell. .

Erratum in

  • Mol Biol Cell. 2010 Oct 15;21(20):3615

Abstract

Plakophilin 2 (PKP2), an armadillo family member closely related to p120 catenin (p120ctn), is a constituent of the intercellular adhesive junction, the desmosome. We previously showed that PKP2 loss prevents the incorporation of desmosome precursors enriched in the plaque protein desmoplakin (DP) into newly forming desmosomes, in part by disrupting PKC-dependent regulation of DP assembly competence. On the basis of the observation that DP incorporation into junctions is cytochalasin D-sensitive, here we ask whether PKP2 may also contribute to actin-dependent regulation of desmosome assembly. We demonstrate that PKP2 knockdown impairs cortical actin remodeling after cadherin ligation, without affecting p120ctn expression or localization. Our data suggest that these defects result from the failure of activated RhoA to localize at intercellular interfaces after cell-cell contact and an elevation of cellular RhoA, stress fibers, and other indicators of contractile signaling in squamous cell lines and atrial cardiomyocytes. Consistent with these observations, RhoA activation accelerated DP redistribution to desmosomes during the first hour of junction assembly, whereas sustained RhoA activity compromised desmosome plaque maturation. Together with our previous findings, these data suggest that PKP2 may functionally link RhoA- and PKC-dependent pathways to drive actin reorganization and regulate DP-IF interactions required for normal desmosome assembly.


Figures
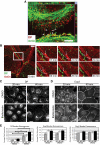
Figure 1.
Figure 1.
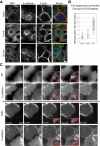
Desmoplakin cytoplasmic particles are found in close proximity to cortical actin and border localization of desmoplakin involves myosin II contractility. (A) SCC9 cells grown overnight in low-calcium medium (0.05 mM) were switched to normal calcium levels for 30 min to induce junction assembly. Cells were fixed with 4% formal saline followed by 0.2% Triton X-100 extraction. Cells were then incubated with primary antibodies against desmoplakin (DP) followed by incubation with Alexa Fluor 568–conjugated secondary antibody and Alexa Fluor 488–labeled phalloidin to visualize actin. DP containing precursor particles are found in close proximity with the actomyosin network (arrows). One XY plane is shown along with the orthogonal planes for the captured Z-stack. Bar, 5 μm. (B) SCC12f cells coexpressing DP.GFP and actin.mCherry were wounded and imaged at 1-min intervals after cell–cell contact. DP precursor particles (white arrows, 1–3) move toward contact sites in coordination with the reorganizing junctional actin. The white box in the full field of view (left) is enlarged and shown for six time points illustrating particle movement and actin reorganization. Bar, 10 μm. See also Supplemental Video 1. (C–E) Cells cultured overnight in low-calcium medium were preincubated for 10 min in the presence of 25 μM blebbistatin or DMSO carrier before switching them to normal calcium containing 25 μM blebbistatin for 20-, 40, and 60-min time points. Cells were fixed with anhydrous methanol and incubated with primary antibodies against DP (C), E-cadherin (Ecad; D), or desmoglein 2 (Dsg2) followed by incubation with Alexa Fluor 488–conjugated secondary antibodies. Bar, 20 μm (E) Average pixel intensities for DP, Ecad, or Dsg2 were quantified along sites of cell–cell contact within the population. Quantitative analyses of immunostained images captured from >10 fields and >30 borders per condition were assessed using Metamorph software; *p < 0.05. The experiments shown are representative of three or more experiments. Although the border localization of Dsg2 and E-cad were unaffected by blebbistatin treatment, DP localization at borders was decreased about four-fold by the inhibition of myosin II.
Figure 2.
Figure 2.
PKP2 is present at cell borders early after cell–cell contact. (A) SCC9s were subjected to calcium switch and then fixed with 4% formal saline followed by 0.2% Triton X-100 extraction at 10 or 60 min and incubated with primary antibodies against PKP2 or E-cadherin (Ecad), followed by incubation with 568 Alexa–conjugated secondary antibodies and phalloidin. Bar, 20 μm. PKP2, Ecad, and actin are all localized at nascent cell–cell contacts within 10 min. (B) SCC9 cells expressing pairs of the junction molecules with GFP- or mCherry-tags were imaged during junction formation. Whisker diagrams demonstrate the temporal sequence of PKP2, Ecad, and DP appearance at nascent cell–cell contacts. On average, Ecad appears at nascent contact sites within 3 min, followed closely by PKP2 at 4 min, whereas DP appears ∼10 min after initial cell–cell contact. The experiments shown are a compilation of 39 total experiments. (C) Stills from movies of cells expressing Ecad-mCherry and DP-GFP (top panels) or Ecad-GFP and PKP2-mCherry (bottom panels). Insets, magnification of early cell–cell contacts. Bar, 10 μm. See also Videos 2 and 3. In the Ecad/DP pairing, Ecad appears at sites of cell–cell contact as small puncta within 3 min, whereas DP appears later, within 10 min. In the Ecad/PKP2 pairing Ecad appears at 1½ min after cell contact with PKP2 appearing shortly thereafter at 3 min.
Figure 3.
Figure 3.
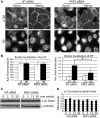
PKP2 KD does not affect the distribution of the adherens junction protein p120ctn. (A) Cells transfected with siRNA against PKP2 or a nontargeting control (NT siRNA) were subjected to a calcium switch for 15 or 90 min and fixed with 4% formal saline followed by 0.2% Triton X-100 extraction. Cells were incubated with primary antibodies against p120ctn or DP followed by incubation with Alexa Fluor 488– and 568–labeled antibodies, respectively. Bar, 20 μm. (B) Average pixel intensities for p120ctn and DP, were quantified along sites of cell–cell contact within the population. Quantitative analyses of immunostained images captured from >10 fields and >40 borders per condition were assessed using Metamorph software; *p < 0.05. The experiments shown are representative of three experiments. Although DP border localization was decreased upon PKP2 KD at 90 min, p120ctn border localization was unaffected. (C) PKP2 KD or the NT siRNA cells were subjected to calcium switch and then harvested at 0-, 5-, 15-, and 30-min time points and analyzed by SDS-PAGE and immunoblotting. p120ctn total levels do not change upon PKP2 KD. (D) Densitometric analysis of the Western blots shown in C.
Figure 4.
Figure 4.
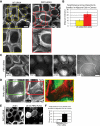
Loss of PKP2 results in changes in cortical actin organization during junction assembly. Cells transfected with siRNA against PKP2 or a nontargeting control (NT-siRNA) were subjected to a calcium switch. Cells were fixed at 60 min with 4% formal saline followed by 0.2% Triton X-100 extraction. (A) Fixed cells were incubated with phalloidin to visualize F-actin. Cortical actin is tightly bundled within 60 min of cell–cell contact as observed in control cells (NT siRNA), whereas PKP2 KD the bundles do not appear as tightly bundled. Bar, 20 μm. (B) The width of paired cortical actin bundles across adjacent cells (includes the space between the bundles and the sum of the two bundles themselves in micrometers); p < 0.05. The actin bundles in the PKP2 KD cells cover more distance in the cytoplasm than the cortical actin ring in the control population (NT siRNA). (C) PKP2 KD cells were incubated with primary antibodies against PKP2 and p120ctn, followed by incubation with Alexa Fluor 568– and 488–conjugated secondary antibodies and Alexa Fluor 350 conjugated phalloidin. Bar, 20 μm. Cells are in contact, as indicated by the presence of p120ctn at the maturing cell–cell borders. The region of cell–cell contact is indicated by a white line in the DIC micrograph. (D) PKP2 KD cells were incubated with primary antibodies against DP, followed by incubation with Alexa Fluor 488–conjugated secondary antibodies and Alexa Fluor 568–conjugated phalloidin. Bar, 10 μm. DP containing precursor particles are retained within the loose microfilament bundles in the cell cortex. (E) Cells were transfected with PKP2 siRNA 48 h before being transfected with silencing resistant PKP2-FLAG. Twenty-four hours after the second transfection the cells were subjected to a calcium switch. Cells were incubated with antibodies against the FLAG tag followed by incubation with Alexa Fluor 568–conjugated secondary antibodies and Alexa Fluor 488–conjugated phalloidin. Bar, 20 μm. Reintroduction of PKP2-FLAG restores contracted appearance of the cortical actin ring. (F) The total distance (in micrometers) across paired actin bundles in PKP2 KD cells is compared with that in the population of cells expressing the rescue construct. Quantitative analyses of immunostained images captured from >10–15 fields and >40 borders per condition were assessed using Metamorph software; *p < 0.05. The experiments shown are representative of three experiments.
Figure 5.
Figure 5.
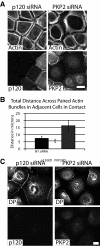
PKP2-mediated changes in actin organization are not shared by p120 cat. (A) Cells were transfected with siRNA against either p120ctn or PKP2 and fixed with 4% formal saline after a 90-min calcium switch. Cells were incubated with antibodies against p120ctn or PKP2 followed by incubation with Alexa Fluor 568–conjugated secondary antibodies and Alexa Fluor 488–conjugated phalloidin. Bar, 20 μm. Although PKP2 KD cells exhibit more widely spaced bundles, p120ctn KD cell actin bundles are more condensed. (B) The width of paired cortical actin bundles of adjacent KD cells (in micrometers). Quantitative analyses of immunostained images captured from >10–15 fields and >80 borders per condition were assessed using Metamorph software; *p < 0.05. (C) Cells transfected with siRNA against either p120ctn or PKP2 were fixed with anhydrous methanol after a 90-min calcium switch. Cells were incubated with primary antibodies against DP and p120ctn or PKP2, followed by incubation with Alexa Fluor 488– and 568–conjugated secondary antibodies, respectively. *p < 0.05. Bar, 20 μm. p120ctn loss does not hinder the localization of DP to cell–cell borders, whereas DP localization is hindered, as expected, upon PKP2 loss (Bass-Zubek et al., 2008). The experiments shown are representative of three experiments.
Figure 6.
Figure 6.
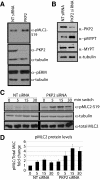
The actomyosin contractile machinery is affected by PKP2-deficiency. SCC9 cells were transfected with siRNA against PKP2 or NT siRNA controls and harvested at steady-state conditions (A and B) or harvested after being subjected to calcium switch (C and D). Lysates were subjected to SDS-PAGE and Western blotting and probed for antibodies recognizing the phosphorylated forms of the actin modulating proteins, ERMs and MLC, as well as PKP2, pMYPT, total MLC, and tubulin. Upon PKP2 KD MLC activity increases (A), and the activity of the myosin phosphatase responsible for inactivating MLC decreases (B). (C) MLC phosphorylation (pMLC-S19) increases transiently after calcium switch in both control and PKP2 KD populations. The levels of pMLC are elevated in PKP2 KD at every time point compared with the control, although no change in observed in total MLC levels. (D) Densitometry of the Western blots. The experiments shown are representative of three experiments.
Figure 7.
Figure 7.
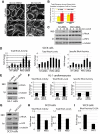
PKP2 KD results in increased RhoA activity. (A) SCC9 cells transfected with siRNA against PKP2 or NT siRNA controls were subjected to a calcium switch assay for 60 min in the presence or absence of the RhoA activator LPA at 10 μM followed by fixation with 4% formal saline and extracted with 0.2% Triton X-100, followed by incubation with Alexa Fluor 488–conjugated phalloidin. Bar, 20 μm. Cortical actin arrangement in LPA-treated NT siRNA cells mimics that observed in the PKP2 KD cells. LPA treatment of PKP2 KD cells resulted in a modest increase in stress fibers beyond the amount observed upon PKP2 KD alone. (B) The width of paired cortical actin bundles across adjacent cells (in micrometers) illustrates that upon LPA treatment the NT siRNA control and PKP2 KD populations are virtually indistinguishable. (C) Cells transfected with siRNA against PKP2 or NT siRNA controls were subjected to a calcium switch assay and harvested at various time points (0–30 min). GST-RBD pulldowns were performed to precipitate GTP-bound RhoA from each lysate. RhoA activity transiently increases in response to calcium in both control and PKP2 KD conditions, although the PKP2 KD cells have an increased in total RhoA levels and an increased level of RhoA activity at all time points examined, which is quantified by densitometry in D and is an average of three independent experiments. (E) HL-1 atrial cardiomyocyte cultures were transfected with siRNA against PKP2 or NT siRNA controls and collected in steady-state conditions for GST-RBD pulldown analysis. RhoA total levels and activity are both increased upon PKP2 KD, which is quantified by densitometry in F. (G) Overexpression of PKP2-GFP in cells decreases the activity of RhoA. GST-RBD pulldowns were performed on cells expressing PKP2-GFP by viral transduction. PKP2-GFP–expressing cells show a decrease in RhoA activity compared with control cells, which is quantified in H. (I) The results in G and H, which were obtained using traditional GST-RBD pulldowns, were confirmed using a G-LISA assay.
Figure 8.
Figure 8.
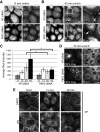
RhoA is mislocalized upon PKP2 loss. Cells transfected with siRNA against PKP2 or NT siRNA controls were subjected to a calcium switch assay (0–45 min) and fixed in 10% TCA followed by 0.2% Triton X-100. Cells were incubated with primary antibodies against DP and RhoA, followed by incubation with Alexa Fluor 568– and 488–conjugated secondary antibodies, respectively. (A and B) Within 45 min after calcium addition RhoA is localized to regions of nascent cell–cell contact in the control population (NT siRNA), whereas it is absent from sites of contact in the PKP2 KD cells. Bar, 20 μm. (C) The fluorescence intensity of RhoA at cell–cell borders was quantified and compared for the NT siRNA control and PKP2 KD populations; *p < 0.05. Quantitative analyses of immunostained images captured from >10–15 fields and >10 borders per condition were assessed using Metamorph software; *p < 0.05. (D) This ability of RhoA to localize to sites of cell–cell contact was rescued by introduction of a silencing resistant PKP2-FLAG construct. Bar, 20 μm. (E) Cells were subjected to a calcium switch (15 and 60 min) or cultured in normal calcium conditions (NCM) in the presence of 10 μM LPA or DMSO vehicle. Cells were fixed with 4% fomal saline and extracted with 0.2% Triton X-100 followed by incubation with primary antibodies against DP and Alexa Fluor–conjugated secondary antibody. Bar, 20 μm. Activation of RhoA via LPA treatment increases the early accumulation of DP at cell–cell contact sites, whereas sustained activity somewhat diminishes DP border accumulation relative to control at 60 min. The experiments shown in the figure are representative of three experiments.
Figure 9.
Figure 9.
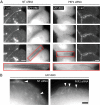
Localization of Rho activity to sites of nascent cell–cell contact requires PKP2 expression. (A) Cells retrovirally transduced to express E-cadherin (E-cad).mCherry were transfected with siRNA against PKP2 or NT siRNA controls followed by a separate EGFP-RBD transfection 24 h before time-lapse imaging. Cells were subjected to a calcium switch assay followed by single plane, live cell imaging at 20-s intervals. EGFP-RBD, which binds to active, endogenous Rho accumulated at sites of cell–cell contact in the control cells, but was not observed to accumulate at the contact site of PKP2 KD cells, although E-cad does. The red boxed area is magnified to show region of cell–cell contact in control (NT siRNA) and PKP2 KD cells. See Videos 4 and 5. Bar, 10 μm. (B) Although active Rho did not accumulate at sites of cell–cell contact in PKP2 KD cells, it was observed in the lamellar ruffles of both control and PKP2 KD cells. See Video 5. Bar, 5 μm. Twenty NT siRNA control cell pairs and 31 PKP2 KD cell pairs were imaged over the course of several weeks for analysis of active Rho accumulation.
Figure 10.
Figure 10.
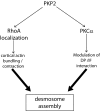
A schematic representation depicting proposed PKP2-dependent pathways important for desmosomal plaque assembly. The data are consistent with a model in which PKP2 orchestrates DP incorporation into desmosomes through two pathways: 1) by acting as a scaffold that recruits PKCα to DP to modulate its interaction with intermediate filaments (IF; Godsel et al., 2005; Bass-Zubek et al., 2008), and 2) by localizing RhoA at sites of nascent junction assembly and regulating cortical actin remodeling necessary for DP accumulation and junction maturation.

Similar articles

Cited by

References

    1. Anastasiadis P. Z., Moon S. Y., Thoreson M. A., Mariner D. J., Crawford H. C., Zheng Y., Reynolds A. B. Inhibition of RhoA by p120 catenin. Nat. Cell Biol. 2000;2:637–644. - PubMed
    1. Anastasiadis P. Z., Reynolds A. B. Regulation of Rho GTPases by p120-catenin. Curr. Opin. Cell Biol. 2001;13:604–610. - PubMed
    1. Angst B. D., Nilles L. A., Green K. J. Desmoplakin II expression is not restricted to stratified epithelia. J. Cell Sci. 1990;97(Pt 2):247–257. - PubMed
    1. Bass-Zubek A. E., Godsel L. M., Delmar M., Green K. J. Plakophilins: multifunctional scaffolds for adhesion and signaling. Curr. Opin. Cell Biol. 2009;21:708–716. - PMC - PubMed
    1. Bass-Zubek A. E., Hobbs R. P., Amargo E. V., Garcia N. J., Hsieh S. N., Chen X., Wahl J. K., 3rd, Denning M. F., Green K. J. Plakophilin2, a critical scaffold for PKC alpha that regulates intercellular junction assembly. J. Cell Biol. 2008;181:605–613. - PMC - PubMed

Publication types

MeSH terms

LinkOut - more resources