. 2010 Jun 16;30(24):8251-62.
doi: 10.1523/JNEUROSCI.5361-09.2010.

State-dependent interactions between excitatory neuromodulators in the neuronal control of breathing

Affiliations

State-dependent interactions between excitatory neuromodulators in the neuronal control of breathing

Atsushi Doi et al. J Neurosci. .

Abstract

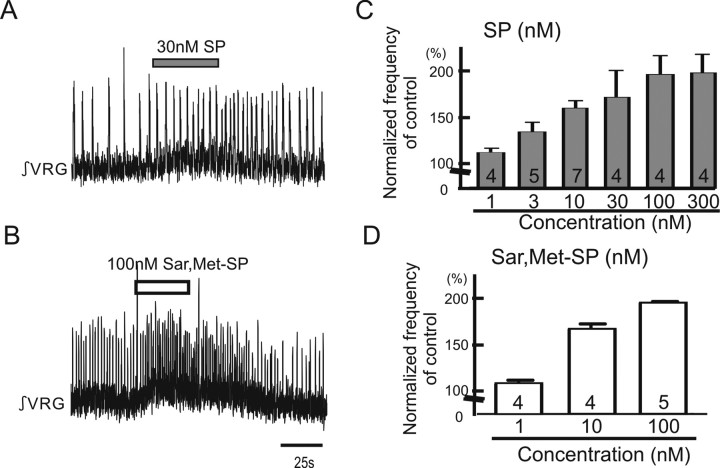
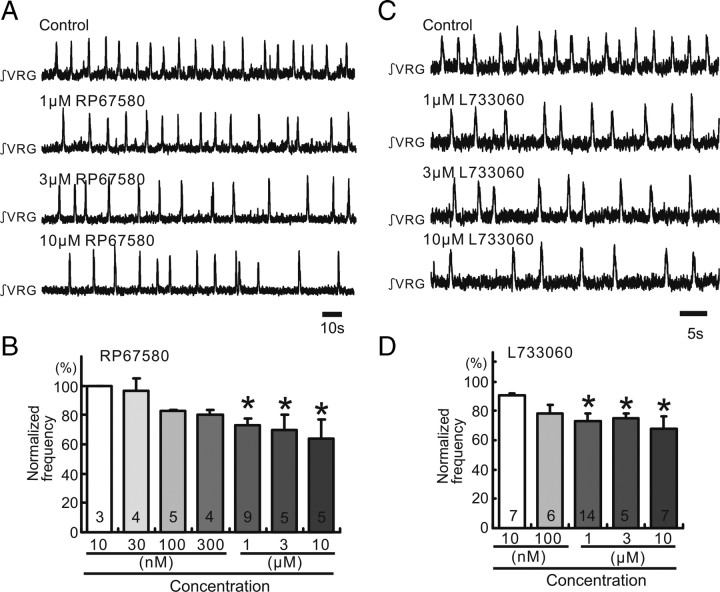
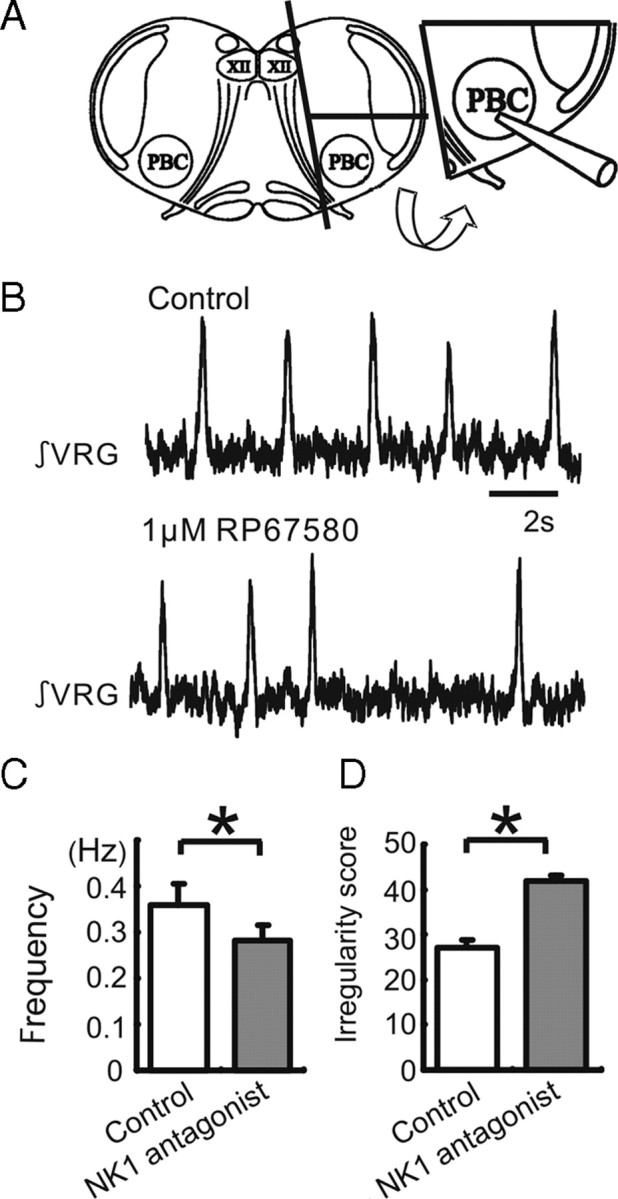
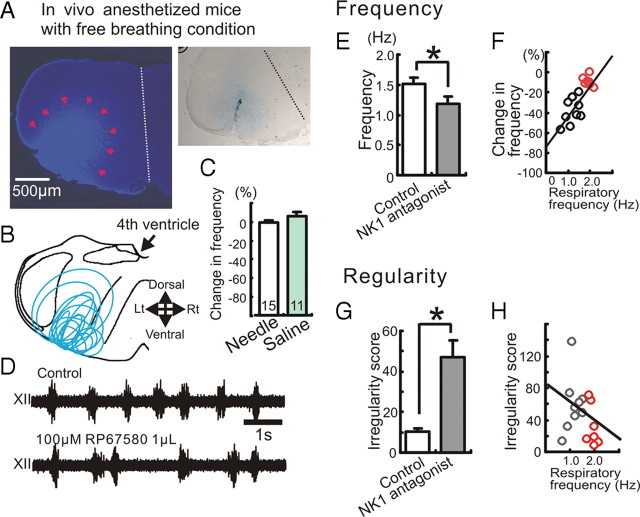
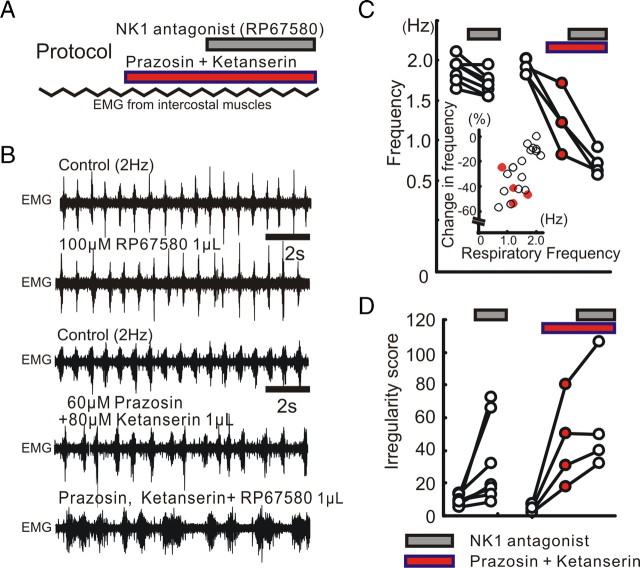
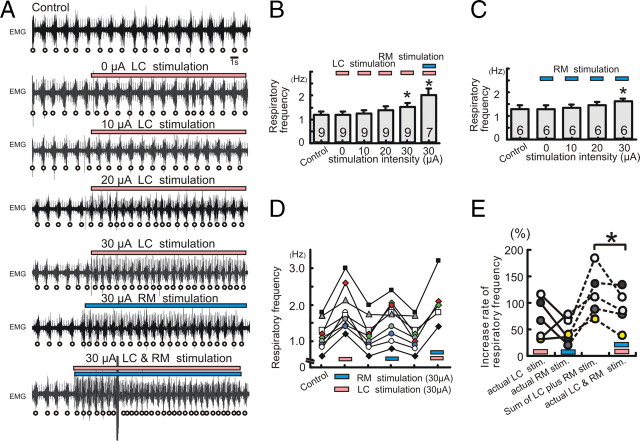
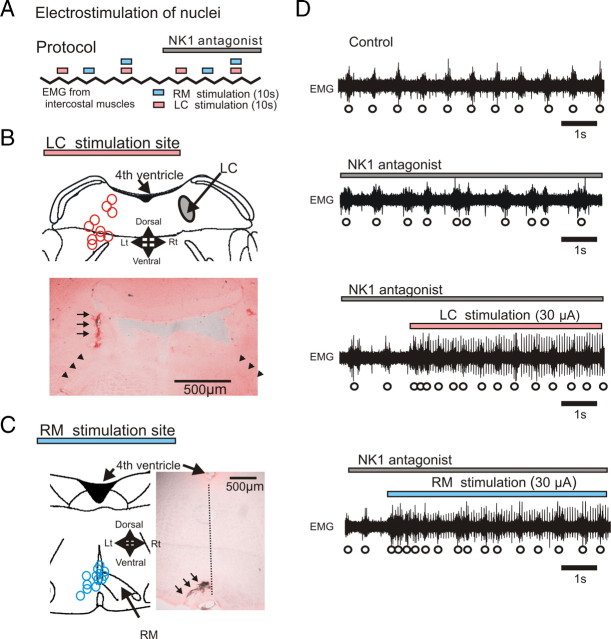
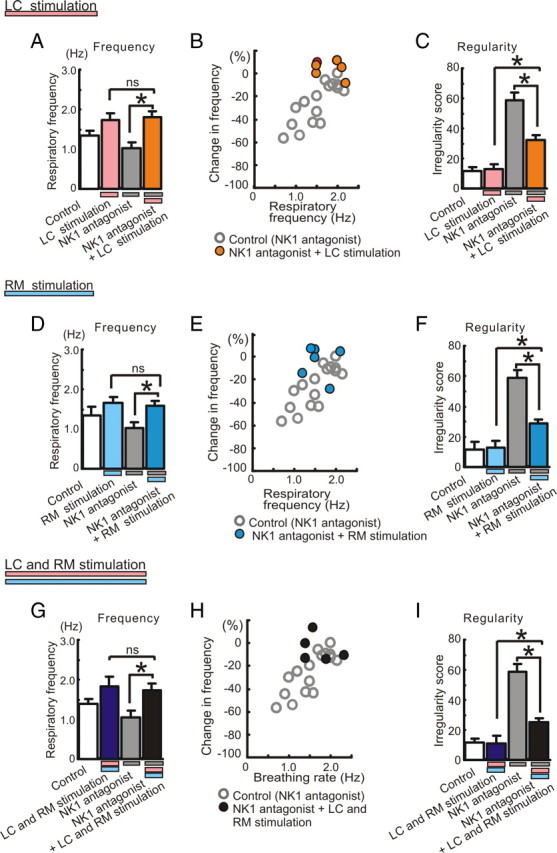
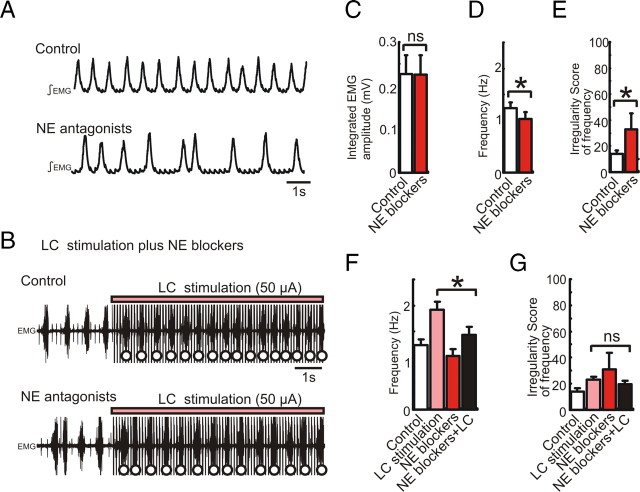
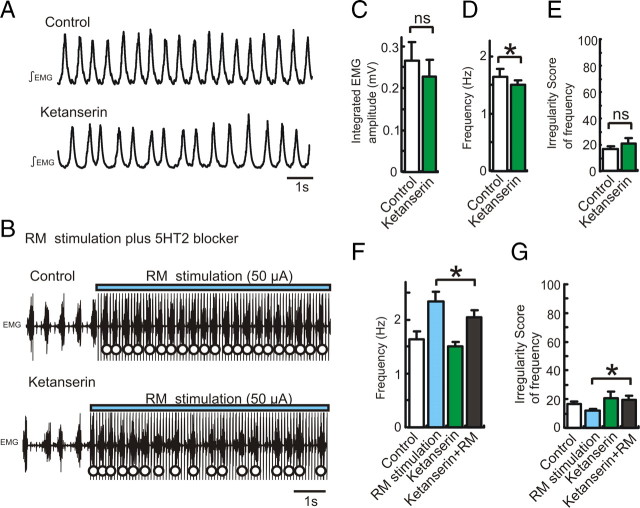
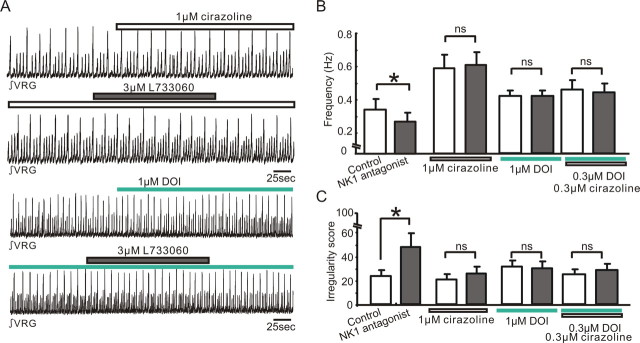
All neuronal networks are modulated by multiple neuropeptides and biogenic amines. Yet, few studies investigate how different modulators interact to regulate network activity. Here we explored the state-dependent functional interactions between three excitatory neuromodulators acting on neurokinin1 (NK1), alpha1 noradrenergic (alpha1 NE), and 5-HT2 serotonin receptors within the pre-Bötzinger complex (pre-BötC), an area critical for the generation of breathing. In anesthetized, in vivo mice, the reliance on endogenous NK1 activation depended on spontaneous breathing frequency and the modulatory state of the animal. Endogenous NK1 activation had no significant respiratory effect when stimulating raphe magnus and/or locus ceruleus, but became critical when alpha1 NE and 5-HT2 receptors were pharmacologically blocked. The dependence of the centrally generated respiratory rhythm on NK1 activation was blunted in the presence of alpha1 NE and 5-HT2 agonists as demonstrated in slices containing the pre-BötC. We conclude that a modulator's action is determined by the concurrent modulation and interaction with other neuromodulators. Deficiencies in one neuromodulator are immediately compensated by the action of other neuromodulators. This interplay could play a role in the state dependency of certain breathing disorders.


Figures

Figure 1.
Figure 1.
Exogenous application of either SP or NK1 agonist facilitates respiratory population activity recorded in medullary slice preparation containing the pre-BötC. Shown are effects of SP and NK1 agonist Sar,Met-SP on respiratory rhythmic activity recorded in a portion of the VRG containing the pre-BötC in vitro. A, B, Two traces of integrated activity obtained from extracellular population activity recorded from the surface of a portion of the VRG that contains the pre-BötC. Upward deflections reflect bursts of fictive inspiratory activity. Note that application of 30 nm SP (A) and 100 nm Sar,Met-SP (B) facilitates respiratory activity. C, D, Graphs indicating that SP (C) and Sar,Met-SP (D) enhance respiratory rhythmic activity in a dose-dependent manner (collected number is shown in each bar graph).
Figure 2.
Figure 2.
Endogenous SP release activates NK1 receptors in medullary slice preparation containing the pre-BötC. A, C, Integrated activity obtained from extracellular population activity recorded from the surface of a portion of the VRG containing the pre-BötC. Increasing concentrations of the NK1 antagonists RP67580 (A) and L733060 (C) cause an increased inhibitory effect on rhythmic population activity (traces). B, D, Graphs indicating that RP67580 (B) and L733060 (D) inhibit the frequency of respiratory rhythmic activity (ordinate) in a dose-dependent manner (abscissa; *p < 0.05, number is shown in each bar graph). The frequency values were normalized to the control frequency obtained before the application of the NK1 antagonists (100%).
Figure 3.
Figure 3.
Endogenous SP activation persists in pre-BötC island preparation. Shown is the effect of the NK1 antagonist on respiratory population activity recorded from a pre-BötC island slice. A, Schematic of a transverse slice (left schematic), which is used to isolate an island slice (right schematic) that contains the pre-BötC and a minimal amount of surrounding tissue. B, Integrated population activity obtained from extracellular activity recorded from the surface of a portion of the VRG containing the pre-BötC under control conditions (top trace) and following the application of the NK1 antagonist RP67580 (bottom trace). C, D, The application of the NK1 antagonist RP67580 decreases significantly the frequency (C) and increases the irregularity of respiratory rhythmic activity (D). The irregularity is expressed as the “irregularity score” as explained in Materials and Methods (white bar: control, gray bar: 1 μm RP67580, n = 5).
Figure 4.
Figure 4.
The inhibitory effect of NK1 antagonist on respiratory activity depends on the breathing frequency in the anesthetized animal. Shown is the effect of NK1 antagonist on respiratory activity in in vivo mice. A, Left, Identification of the injection site by Evans blue, which was injected together with the NK1 antagonist. Right, The tract of a single needle that was inserted into the pre-BötC from the ventral side. B, Schematic of the medulla indicating that all injection sites were located in the ventral medulla in the area of the pre-BötC. C, Graph indicating that the needle insertion (white bar) and the injection of saline (green bar) have no significant effect on respiratory activity. D, Extracellularly recorded XII activity in control (top trace) and following the injection of NK1 antagonist into the hemilateral pre-BötC (bottom trace). E, The injection of the NK1 antagonist (RP67580, 100 μm, 1 μl) modulates the respiratory frequency (*p < 0.05, n = 16). F, Scatter plot illustrates a direct relationship between the percentage change in respiratory frequency (ordinate) and the baseline breathing frequency of the animal before the injection of the antagonist (abscissa). The percentage change in respiratory frequency describes the percentage frequency decrease caused by the NK1 antagonist compared to the control frequency before the antagonist injection. Note that the inhibitory effect of the NK1 antagonist depends significantly on the control breathing frequency in the anesthetized animal (y = 31.96x − 74.11, R2 = 0.633). G, The injection of NK1 antagonist increases the irregularity score (*p < 0.05). H, Scatter plot illustrates that there is no significant relationship between the irregularity score (ordinate) and the baseline respiratory frequency (abscissa) (y = −24.4x − 83.5, R2 = 0.11).
Figure 5.
Figure 5.
The modulatory role of NK1 receptors depends on the activation of α1 NE and 5-HT2 receptors. A, Schematic illustrating the experimental protocol used for examining the relationship between NK1, α1 NE, and 5-HT2 receptors. B, EMG activity recorded from intercostal muscles under control conditions (top trace), following the injection of the NK1 antagonist (RP67580, second trace), control conditions of the other case (third trace), following the injection of a cocktail containing prazosin and ketanserin (fourth trace), and following the additional injection of the NK1 antagonist (bottom trace). C, D, The effects of the NK1 antagonist (gray bars) on respiratory frequency (C) and irregularity score (D) of the respiratory frequency are enhanced following the concurrent injection of α1 NE and 5-HT2 antagonists (red bars). The inset in C illustrates that blocking both α1 NE and 5-HT2 receptors decreases the respiratory frequency, indicated as a negative percentage change (red dots).
Figure 6.
Figure 6.
Electrical stimulation of LC or RM facilitates respiratory activity in an intensity-dependent manner. A, EMG activity obtained from intercostal muscles under control condition (top trace), in the presence of 0 μA LC stimulation (second trace), 10 μA LC stimulation (third trace), 20 μA LC stimulation (fourth trace), 30 μA LC stimulation (fifth trace), 30 μA RM stimulation (sixth trace), and 30 μA LC plus RM stimulation (bottom trace). B, C, Bar graphs illustrating that electrical stimulation of LC (pink bar) and/or RM (blue bar) increase respiratory activity in an intensity-dependent manner (B and C, *p < 0.05). D, Graph illustrating that the effect on respiratory activity is completely reversible upon termination of the stimulation (pink bar, LC; blue bar, RM stimulation). E, Graph illustrating the percentage increases in respiratory frequency caused by separate LC stimulation (pink bar) and RM stimulation (blue bar), the sum calculated from the sum of each of these separate stimulations, and the actual increases caused by the simultaneous stimulation of LC and RM. Each dot represents a stimulation experiment. Experiments conducted in the same animals are connected by lines.
Figure 7.
Figure 7.
Electrostimulation of LC or RM blunts inhibitory effects of NK1 receptors. A, Schematic illustrating the experimental protocol for the electrical stimulation of LC (pink bars) and RM (blue bars) in the absence and presence of NK1 antagonist (gray bar). B, C, Stimulation sites of LC (B, pink circles) and RM (C, blue circles) were labeled at the end of each experiment by injecting a high current amplitude into the stimulation electrode (anatomical labeling is indicated by arrows in the histological sections shown in B and C). D, EMG activity obtained from intercostal muscles under control conditions (top trace), during the injection of the NK1 antagonist (second trace), during electrical stimulation of LC while injecting the NK1 antagonist (third trace), and during RM electrical stimulation while injecting the NK1 antagonist (bottom trace).
Figure 8.
Figure 8.
Effects of electrical stimulation of LC and/or RM on the frequency and regularity changes caused by NK1 antagonists. A, D, G, The inhibitory effect of the NK1 antagonist on respiratory frequency is abolished by electrical stimulation of LC (A, *p < 0.05; ns, no significance; n = 6), RM (D, *p < 0.05; ns, no significance; n = 6), or both (G, *p < 0.05; ns, no significance; n = 5). B, E, H, Scatter plots illustrating the relationship between percentage change in respiratory frequency (ordinate) and baseline respiratory frequency (abscissa) before manipulating the preparations. The ordinate reflects the percentage change in frequency compared to the control frequency (100%) in any given preparation. Note that electrical stimulation of LC and/or RM significantly reduces the irregularity score caused by the NK1 antagonist, but does not fully recover the regularity when compared to control conditions (C, F, I, *p < 0.05).
Figure 9.
Figure 9.
Electrical stimulation of LC induces endogenous release of NE and acts on NE receptors presumably within the pre-BötC. A, Integrated EMG activity obtained from intercostal muscle under control conditions (top trace) and following the injection of a cocktail of NE antagonists containing prazosin (30 μm), yohimbine (1 μm), and alprenolol (30 μm, total 0.6 μl, bottom trace). B, EMG activity recorded during LC stimulation under control conditions (top trace) and following the injection of the cocktail containing NE antagonists (bottom trace). C–E, Bar graphs illustrating the effects of NE antagonists on integrated respiratory amplitude (C, ns, n = 5), frequency (D, *p < 0.05), and regularity of respiratory frequency (E, *p < 0.05). F, G, Bar graphs illustrating that LC stimulation (pink bars) affects only respiratory frequency (F, *p < 0.05, n = 5), but not the regularity of the frequency (G, irregularity score, ns) under control conditions (white bars) and following the injection of the cocktail containing NE antagonists (red bars).
Figure 10.
Figure 10.
Electrical stimulation of RM facilitates endogenous release of 5-HT and activates 5-HT2 receptor presumably in the pre-BötC. A, Integrated EMG activity obtained from intercostal muscle under control conditions (top trace) and following the injection of the 5-HT2 antagonist (ketanserin 80 μm, 0.6 μl, bottom trace). B, EMG activity recorded during RM stimulation under control conditions (top trace) and following the injection of ketanserin (bottom trace). C–E, Bar graphs illustrating the effects of ketanserin on integrated EMG amplitude (C, ns, n = 8), frequency (D, *p < 0.05), and regularity of respiratory frequency (E, ns). F, G, Bar graphs illustrating that RM stimulation (blue bars) affects respiratory frequency (F, *p < 0.05, n = 8) and the regularity of the frequency (G, irregularity score, *p < 0.05) under control conditions (white bars) and following the injection of ketanserin (green bars).
Figure 11.
Figure 11.
Interactions between NK1, α1 NE, and 5-HT2 receptors in slice preparations. A, Integrated activity obtained from population activity recorded extracellularly from the surface of a portion of the VRG containing the pre-BötC. Note the slice exhibited spontaneously normal respiratory activity (small upward deflections) as well as large amplitude deflections that reflect fictive sigh activity (Lieske et al., 2000). Integrated activity was recorded in the presence of the α1 NE agonist cirazoline before (top trace, white bar) and during the application of the NK1 antagonist L733060 (second trace, gray bar), as well as in the presence of the 5-HT2 agonist DOI before (third trace, green bar) and during the application of the NK1 antagonist L733060 (fourth trace, gray bar). B, C, Bar graphs quantifying the effects on frequency (B) and irregularity score (C) under the conditions before (white bars) and during the application of the NK1 antagonist (3 μm L733060; black bars). The bar graphs from left to right illustrate the effects of the NK1 antagonist under control conditions, in the presence of 1 μm cirazoline, 1 μm DOI, and 0.3 μm DOI plus 0.3 μm cirazoline (bar graphs from left to right, *p < 0.05, n = 5).

Similar articles

Cited by

References

    1. Achard P, Zanella S, Rodriguez R, Hilaire G. Perinatal maturation of the respiratory rhythm generator in mammals: from experimental results to computational simulation. Respir Physiol Neurobiol. 2005;149:17–27. - PubMed
    1. Barthe JY, Clarac F. Modulation of the spinal network for locomotion by substance P in the neonatal rat. Exp Brain Res. 1997;115:485–492. - PubMed
    1. Benavides DR, Quinn JJ, Zhong P, Hawasli AH, DiLeone RJ, Kansy JW, Olausson P, Yan Z, Taylor JR, Bibb JA. Cdk5 modulates cocaine reward, motivation, and striatal neuron excitability. J Neurosci. 2007;27:12967–12976. - PMC - PubMed
    1. Ben-Mabrouk F, Tryba AK. Substance P modulation of TRPC3/7 channels improves respiratory rhythm regularity and ICAN-dependent pacemaker activity. Eur J Neurosci. 2010;31:1219–1232. - PMC - PubMed
    1. Bernard R, Lydic R, Baghdoyan HA. Hypocretin-1 causes G protein activation and increases ACh release in rat pons. Eur J Neurosci. 2003;18:1775–1785. - PubMed

Publication types

MeSH terms

Substances

LinkOut - more resources