. 2010 Oct;299(4):C736-49.
doi: 10.1152/ajpcell.00529.2009. Epub 2010 Jun 16.

Airborne particulate matter selectively activates endoplasmic reticulum stress response in the lung and liver tissues

Affiliations

Airborne particulate matter selectively activates endoplasmic reticulum stress response in the lung and liver tissues

Suzette Laing et al. Am J Physiol Cell Physiol. 2010 Oct.

Abstract

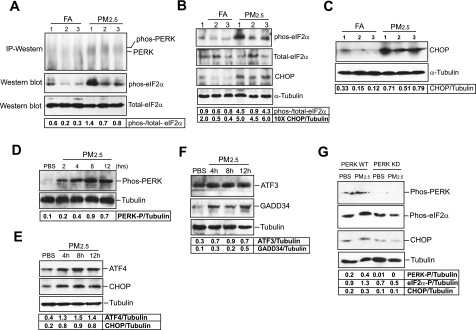
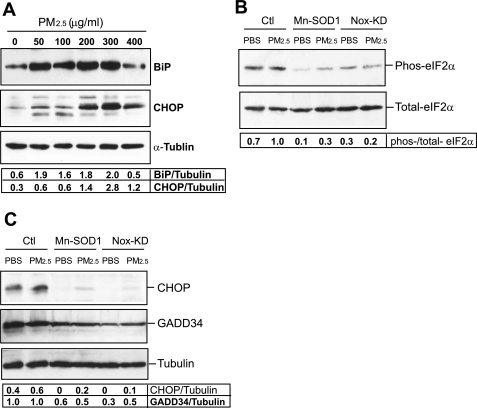
Recent studies have suggested a link between inhaled particulate matter (PM) exposure and increased mortality and morbidity associated with pulmonary and cardiovascular diseases. However, a precise understanding of the biological mechanism underlying PM-associated toxicity and pathogenesis remains elusive. Here, we investigated the impact of PM exposure in intracellular stress signaling pathways with animal models and cultured cells. Inhalation exposure of the mice to environmentally relevant fine particulate matter (aerodynamic diameter < 2.5 μm, PM(2.5)) induces endoplasmic reticulum (ER) stress and activation of unfolded protein response (UPR) in the lung and liver tissues as well as in the mouse macrophage cell line RAW264.7. Ambient PM(2.5) exposure activates double-strand RNA-activated protein kinase-like ER kinase (PERK), leading to phosphorylation of translation initiation factor eIF2α and induction of C/EBP homologous transcription factor CHOP/GADD153. Activation of PERK-mediated UPR pathway relies on the production of reactive oxygen species (ROS) and is critical for PM(2.5)-induced apoptosis. Furthermore, PM(2.5) exposure can activate ER stress sensor IRE1α, but it decreases the activity of IRE1α in splicing the mRNA encoding the UPR trans-activator X-box binding protein 1 (XBP1). Together, our study suggests that PM(2.5) exposure differentially activates the UPR branches, leading to ER stress-induced apoptosis through the PERK-eIF2α-CHOP UPR branch. This work provides novel insights into the cellular and molecular basis by which ambient PM(2.5) exposure elicits its cytotoxic effects that may be related to air pollution-associated pathogenesis.


Figures

Fig. 1.
Fig. 1.
Particulate matter (aerodynamic diameter <2.5 μm, PM2.5) particles are retained intracellularly and induces oxidative stress in vivo. A and B: transmission electron micrographs of lung and liver macrophages from the mice exposed to PM2.5 or filtered air (FA) for 10 wk. E, ER; M, mitochondria. C: dihydroethidium (DHE) staining of liver tissue sections from the mice exposed to FA or PM2.5. Frozen liver tissue sections were stained with DHE (10 μmol/l). The oxidative red fluorescence (Texas red) was detected by a Zeiss fluorescence microscope. D: DHE signals were quantified by counting the number of positive-stained nuclei in 8 random fields. Microscopic interference contrast was used to exclude positive signals from noncell origin. The percentages of DHE-positive nuclei (compared with total nuclei) were shown. Data are shown as means ± SE for 6 animals per group. **P < 0.01. P values are shown for statistically significant differences. E: quantitative real-time RT-PCR analysis of the expression of mRNAs encoding glutathione peroxidase-1 (Gpx-1), heme oxygenase-1 (HO-1), superoxide dismutase-1 (SOD1), and SOD2 in the lung tissue of the mice exposed to FA or PM2.5. Fold changes of mRNA levels were determined after normalization to internal control β-actin RNA levels. For each comparison group, the mRNA level of one FA-exposed mouse was defined as 1 and was used to calculate the fold changes of mRNA levels for the other mice. Each bar denotes the means ± SE (n = 6 mice/group). **P < 0.01.
Fig. 2.
Fig. 2.
PM2.5 exposure induces ER stress in the lung and liver tissues. AD: immunohistochemistry staining of lung and liver tissue sections for binding immunoglobulin protein (BiP) expression. The BiP signals were developed with peroxidase substrate reaction (brown signal). The slides were counterstained with hematoxylin. Magnification: ×400. B and D are the percentages of BiP-staining-positive cells in the lung or liver tissue sections of the mice exposed to PM2.5 or FA. The numbers of positive- and negative-stained cells were counted in 8 random fields per sample. The percentages were calculated by normalizing BiP-staining-positive cells to the total cells. Data are shown as means ± SE for 6 animals per group. *P < 0.05. P values are shown for statistically significant differences. E: Western blot analyses for the expression levels of glucose-regulated protein 94 (GRP94) and BiP proteins in the lung tissue of the mice exposed to FA or PM2.5. Denatured lung protein lysates (150 μg per sample) are separated on a 10% Tris-glycine polyacrylamide gel. Levels of α-tubulin protein were determined as internal controls. The values below the gels represent the normalized protein signal intensities. The protein band signals were quantified by using NIH Image J software. F: Western blot analyses for the expression levels of GRP94 and BiP proteins in the liver tissue of the mice exposed to FA or PM2.5. Denatured liver protein lysates (80 μg per sample) are separated on a 10% Tris-glycine polyacrylamide gel. Levels of α-tubulin protein were determined as internal controls. The values below the gels represent the normalized protein signal intensities. For AD, the experiments were repeated at least three times, and the representative data are shown.
Fig. 3.
Fig. 3.
PM2.5 exposure activates the unfolded protein response (UPR) pathway through protein kinase-like ER kinase (PERK)/eIF2α and C/EBP homologous protein (CHOP) in vivo and in vitro. A: immunoprecipitation (IP)-Western blot and Western blot analyses for PERK and phosphorylated and total eIF2α proteins in the livers of the mice exposed to FA or PM2.5. Denatured liver protein lysates (80 μg per sample) are separated on a 10% Tris-glycine polyacrylamide gel. For PERK IP-Western blot analysis, an anti-total PERK antibody was used. The values below the gels represent the ratios of phosphorylated eIF2α to total eIF2α protein signals. B: Western blot analyses for phosphorylated and total eIF2α and CHOP proteins in the lung tissue of the mice exposed to FA or PM2.5. Denatured lung protein lysates (150 μg per sample) are separated on a 10% Tris-glycine polyacrylamide gel. Levels of α-tubulin protein were determined as internal controls. The values below the gels represent the ratios of phosphorylated to total eIF2α and normalized CHOP protein signal intensities. C: Western blot analysis for expression of CHOP protein in the livers of the mice exposed to FA or PM2.5. Denatured liver protein lysates (80 μg per sample) are separated on a 10% Tris-glycine polyacrylamide gel. Levels of α-tubulin protein were determined as internal controls. D: Western blot analysis for phosphorylated PERK in RAW264.7 cells transfected with the vector expressing wild-type PERK. The cells were incubated with PM2.5 (50 μg/ml) for various time intervals. An antiphosphorylated PERK antibody was used for the Western blot analysis. E and F: Western blot analyses for levels of ATF4, CHOP, ATF3, and GADD34 in RAW264.7 cells incubated with PM2.5 (50 μg/ml) for various time intervals. G: Western blot analysis for levels of phosphorylated PERK, phosphorylated eIF2α, and CHOP in the RAW264.7 cells expressing wild-type PERK or PERK kinase dominant negative. RAW264.7 cells were transduced with the vector expressing wild-type PERK (PERK-WT) or PERK kinase dominant negative K618A (PERK KD), and then challenged with PM2.5 (50 μg/ml) or vehicle PBS buffer for 6 h. Levels of phosphorylated PERK were determined by using an anti-phosphorylated PERK antibody. For A–G, the experiments were repeated at least three times, and the representative data are shown. The values below the gels represent the normalized protein signal intensities.
Fig. 4.
Fig. 4.
PM2.5 exposure causes ER stress-induced apoptosis in the lung and liver tissues of mice exposed to PM2.5 or FA. A: DNA fragmentation assay with the lung tissue sections from the mice exposed to PM2.5 or FA. The mice exposed to PM2.5 or FA were euthanized on the final day of exposure, and the lung tissues were fixed for preparing paraffin-embedded sections. The tissue sections were stained for DNA fragmentation using a fluorescent TUNEL staining kit. Fragmented DNAs were stained for green fluorescence, and the cell cytoplasm was stained for red fluorescence. Magnification: ×200. B: quantification of DNA fragmentation in the lung tissues of mice exposed to PM2.5 or FA. The percentages of apoptotic cells were quantified by counting the cells exhibiting positive DNA fragmentation staining in 8 random fields per sample. Data are shown as means ± SE for 6 animals per group. **P < 0.01. P values are shown for statistically significant differences. C: Western blot analysis for caspase-3 in the lung tissues of CHOP knockout or control mice after intranasal inhalation of PM2.5 or vehicle PBS. CHOP knockout (KO) or wild-type (WT) control mice took up ambient PM2.5 in 25 μl PBS (1.6 μg/g body wt) or 25 μl sterile PBS through intranasal inhalation twice for 5 days. Western blot analysis was performed with the mouse lung tissues to detect both the precursor and cleaved caspase-3 proteins. The values below the gels represent the normalized cleaved caspase-3 protein signal intensities.
Fig. 5.
Fig. 5.
PM2.5-induced eIF2α phosphorylation and CHOP induction depends on the production of reactive oxygen species (ROS). A: Western blot analysis of BiP and CHOP expression levels in RAW264.7 cells in response to in vitro exposure to PM2.5 particles at different concentrations ranging from 50 to 400 μg/ml for 6 h. Levels of α-tubulin protein were determined as internal controls. B and C: Western blot analyses for phosphorylated and total eIF2α, CHOP, and GADD34 in RAW264.7 cells under in vitro exposure to PM2.5 or PBS. RAW264.7 cells were infected by adenovirus expressing Mn-SOD1, dominant-negative N17Rac1, or the control vector for 36 h, followed by the incubation with PM2.5 (300 μg/ml) or PBS for 6 h. For AC, the experiments were repeated at least three times, and the representative data are shown. The values below the gels represent the normalized protein signal intensities.
Fig. 6.
Fig. 6.
PM2.5 exposure can activate ER stress sensors IRE1α and ATF6. A: IP-Western blot analysis of IRE1α in the livers of mice exposed to FA or PM2.5. The values below the gels represent the ratios of phosphorylated IRE1α to total IRE1α. B: quantitative real-time RT-PCR analysis for expression levels of the spliced Xbp1 (xbp1s), ERdj4, Edem1, p58(ipk), Bip, Grp94, Pdi-P5, CHOP, and Atf4 mRNAs in the livers of mice exposed to FA or PM2.5. Fold changes of mRNA levels were determined after normalization to internal control β-actin mRNA levels. For each comparison group, the mRNA level of one FA-exposed mouse was defined as 1 and was used to calculate the fold changes of mRNA levels for the other mice. Each bar denotes the mean ± SE (n = 6 mice/group). *P < 0.05. P values are shown for statistically significant differences. C: Western blot analysis of spliced XBP1 protein in the livers of mice exposed to FA or PM2.5. D: quantitative real-time RT-PCR analysis for expression levels of the Pmp22, Col6, HgNat, Blos1, Scara3, and PdgfR mRNAs in the livers of mice exposed to FA or PM2.5. Fold changes of mRNA levels were determined after normalization to internal control β-actin mRNA levels. For each comparison group, the mRNA level of one FA-exposed mouse was defined as 1 and was used to calculate the fold changes of mRNA levels for the other mice. Each bar denotes the mean ± SE (n = 6 mice/group). *P < 0.05. E: Western blot analysis for ATF6 cleavage in RAW264.7 cells expressing full-length ATF6 after PM2.5 challenge. RAW264.7 cells were transfected with the vector expressing HA-tagged full-length ATF6. The transfected cells were treated with PM2.5 (50 μg/ml) for various time intervals. ATF6 P90 represents the full-length ATF6, and ATF6 P50 represents the cleaved form of ATF6. The experiment was repeated three times, and the representative data are shown.
Fig. 7.
Fig. 7.
PM2.5 exposure suppresses the activity of IRE1α in splicing the Xbp1 mRNA. A: detection of unspliced and spliced forms of Xbp1 mRNAs in macrophage cell line RAW264.7 exposed to PM2.5 and/or TM by semiquantitative RT-PCR analysis. RAW264.7 cells were exposed to PM2.5 (300 μg/ml) for 30 min and then treated with tunicamycin (TM, 2 μg/ml) for the time course as indicated. RAW264.7 cells treated with vehicle PBS buffer or with TM for 6 h were included as controls. The size of amplified unspliced Xbp1 mRNA is 170 bp, and the size of amplified spliced Xbp1 mRNA is 144 bp. Levels of β-actin mRNA were determined as internal controls. B: detection of unspliced and spliced forms of Xbp1 mRNAs in mouse hepatocyte cell line H2.35 exposed to PM2.5, TM, or PM2.5 plus TM by semiquantitative RT-PCR analysis. H2.35 cells were exposed to PM2.5 (300 μg/ml) or TM (2 μg/ml) for 2 to 6 h. Additionally, H2.35 cells were exposed to PM2.5 (300 μg/ml) for 30 min and then treated with TM (2 μg/ml) for 2 to 6 h. The cells treated with vehicle PBS buffer were included as the control. Levels of β-actin mRNA were determined as internal controls. For A and B, the experiments were performed at least in triplicate, and the representative data are shown. C: a schematic diagram depicting ER stress response induced by PM2.5 in mouse lung and liver tissues.

Comment in

Similar articles

Cited by

References

    1. Acosta-Alvear D, Zhou Y, Blais A, Tsikitis M, Lents NH, Arias C, Lennon CJ, Kluger Y, Dynlacht BD. XBP1 controls diverse cell type- and condition-specific transcriptional regulatory networks. Mol Cell 27: 53–66, 2007 - PubMed
    1. Alfaro-Moreno E, Martinez L, Garcia-Cuellar C, Bonner JC, Murray JC, Rosas I, Rosales SP, Osornio-Vargas AR. Biologic effects induced in vitro by PM10 from three different zones of Mexico City. Environ Health Perspect 110: 715–720, 2002 - PMC - PubMed
    1. Arantes-Costa FM, Lopes FD, Toledo AC, Magliarelli-Filho PA, Moriya HT, Carvalho-Oliveira R, Mauad T, Saldiva PH, Martins MA. Effects of residual oil fly ash (ROFA) in mice with chronic allergic pulmonary inflammation. Toxicol Pathol 36: 680–686, 2008. - PubMed
    1. American Lung Association State of the Air 2009 http://www.lungusa2.org/sota/2009/SOTA-2009-Full-Print.pdf); 2008Highlights of Recent Research on Particulate Air Pollution: Effects of Long-Term Exposure (http://www.lungusa.org/site/c.dvLUK9O0E/b.36864/k.9F49/State_of_the_Air.htm).
    1. Bommiasamy H, Back SH, Fagone P, Lee K, Meshinchi S, Vink E, Sriburi R, Frank M, Jackowski S, Kaufman RJ, Brewer JW. ATF6alpha induces XBP1-independent expansion of the endoplasmic reticulum. J Cell Sci 122: 1626–1636, 2009 - PMC - PubMed

Publication types

MeSH terms