Deletion of IgG-switched autoreactive B cells and defects in Fas(lpr) lupus mice
- PMID: 20554953
- PMCID: PMC3641794
- DOI: 10.4049/jimmunol.1000698
Deletion of IgG-switched autoreactive B cells and defects in Fas(lpr) lupus mice
Abstract
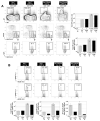
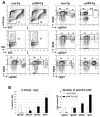
During a T cell-dependent Ab response, B cells undergo Ab class switching and V region hypermutation, with the latter process potentially rendering previously innocuous B cells autoreactive. Class switching and hypermutation are temporally and anatomically linked with both processes dependent on the enzyme, activation-induced deaminase, and occurring principally, but not exclusively, in germinal centers. To understand tolerance regulation at this stage, we generated a new transgenic mouse model expressing a membrane-tethered gamma2a-reactive superantigen (gamma2a-macroself Ag) and assessed the fate of emerging IgG2a-expressing B cells that have, following class switch, acquired self-reactivity of the Ag receptor to the macroself-Ag. In normal mice, self-reactive IgG2a-switched B cells were deleted, leading to the selective absence of IgG2a memory responses. These findings identify a novel negative selection mechanism for deleting mature B cells that acquire reactivity to self-Ag. This process was only partly dependent on the Bcl-2 pathway, but markedly inefficient in MRL-Fas(lpr) lupus mice, suggesting that defective apoptosis of isotype-switched autoreactive B cells is central to Fas mutation-associated systemic autoimmunity.
Figures


Similar articles
-
AID dysregulation in lupus-prone MRL/Fas(lpr/lpr) mice increases class switch DNA recombination and promotes interchromosomal c-Myc/IgH loci translocations: modulation by HoxC4.Autoimmunity. 2011 Dec;44(8):585-98. doi: 10.3109/08916934.2011.577128. Epub 2011 May 18. Autoimmunity. 2011. PMID: 21585311 Free PMC article.
-
Lupus-prone MRL/faslpr/lpr mice display increased AID expression and extensive DNA lesions, comprising deletions and insertions, in the immunoglobulin locus: concurrent upregulation of somatic hypermutation and class switch DNA recombination.Autoimmunity. 2009 Feb;42(2):89-103. doi: 10.1080/08916930802629554. Autoimmunity. 2009. PMID: 19156553 Free PMC article.
-
Hypogammaglobulinaemia occurs in Fas-deficient MRL-lpr mice following deletion of MHC class II molecules.Clin Exp Immunol. 1997 Sep;109(3):473-9. doi: 10.1046/j.1365-2249.1997.4621360.x. Clin Exp Immunol. 1997. PMID: 9328125 Free PMC article.
-
Unique site of IgG2a and rheumatoid factor production in MRL/lpr mice.Immunol Rev. 1997 Apr;156:103-10. doi: 10.1111/j.1600-065x.1997.tb00962.x. Immunol Rev. 1997. PMID: 9176703 Review.
-
Apoptosis defects analyzed in TcR transgenic and fas transgenic lpr mice.Int Rev Immunol. 1994;11(4):321-42. doi: 10.3109/08830189409051178. Int Rev Immunol. 1994. PMID: 7528763 Review.
Cited by
-
Activation-induced cytidine deaminase and aberrant germinal center selection in the development of humoral autoimmunities.Am J Pathol. 2011 Feb;178(2):462-71. doi: 10.1016/j.ajpath.2010.09.044. Am J Pathol. 2011. PMID: 21281778 Free PMC article. Review.
-
The Fas/CD95 Receptor Regulates the Death of Autoreactive B Cells and the Selection of Antigen-Specific B Cells.Front Immunol. 2012 Jul 25;3:207. doi: 10.3389/fimmu.2012.00207. eCollection 2012. Front Immunol. 2012. PMID: 22848207 Free PMC article.
-
Immune tolerance negatively regulates B cells in knock-in mice expressing broadly neutralizing HIV antibody 4E10.J Immunol. 2013 Sep 15;191(6):3186-3191. doi: 10.4049/jimmunol.1301285. Epub 2013 Aug 12. J Immunol. 2013. PMID: 23940276 Free PMC article.
-
AID dysregulation in lupus-prone MRL/Fas(lpr/lpr) mice increases class switch DNA recombination and promotes interchromosomal c-Myc/IgH loci translocations: modulation by HoxC4.Autoimmunity. 2011 Dec;44(8):585-98. doi: 10.3109/08916934.2011.577128. Epub 2011 May 18. Autoimmunity. 2011. PMID: 21585311 Free PMC article.
-
BAFF/APRIL inhibition decreases selection of naive but not antigen-induced autoreactive B cells in murine systemic lupus erythematosus.J Immunol. 2011 Dec 15;187(12):6571-80. doi: 10.4049/jimmunol.1101784. Epub 2011 Nov 18. J Immunol. 2011. PMID: 22102726 Free PMC article.
References
-
- McHeyzer-Williams LJ, Driver DJ, McHeyzer-Williams MG. Germinal center reaction. Curr Opin Hematol. 2001;8:52–59. - PubMed
-
- Diamond B, Katz JB, Paul E, Aranow C, Lustgarten D, Scharff MD. The role of somatic mutation in the pathogenic anti-DNA response. Annu Rev Immunol. 1992;10:731–757. - PubMed
-
- Shlomchik MJ, Marshak-Rothstein A, Wolfowicz CB, Rothstein TL, Weigert MG. The role of clonal selection and somatic mutation in autoimmunity. Nature. 1987;328:805–811. - PubMed
-
- Nemazee DA, Burki K. Clonal deletion of B lymphocytes in a transgenic mouse bearing anti-MHC class I antibody genes. Nature. 1989;337:562–566. - PubMed
Publication types
MeSH terms
Substances
Grants and funding
- AI059714/AI/NIAID NIH HHS/United States
- R01 AR039555/AR/NIAMS NIH HHS/United States
- T32 AI007244/AI/NIAID NIH HHS/United States
- AR39555/AR/NIAMS NIH HHS/United States
- R37 AI059714/AI/NIAID NIH HHS/United States
- R37 AR039555/AR/NIAMS NIH HHS/United States
- R01 AR042242/AR/NIAMS NIH HHS/United States
- R01 AR053228/AR/NIAMS NIH HHS/United States
- R01 AR053731/AR/NIAMS NIH HHS/United States
- T32AI07244/AI/NIAID NIH HHS/United States
- T32 HL007195/HL/NHLBI NIH HHS/United States
- AR42242/AR/NIAMS NIH HHS/United States
- AI51977/AI/NIAID NIH HHS/United States
- AR53228/AR/NIAMS NIH HHS/United States
- T32 HL07195/HL/NHLBI NIH HHS/United States
- R01 AR031203/AR/NIAMS NIH HHS/United States
- R01 AI059714/AI/NIAID NIH HHS/United States
LinkOut - more resources
Full Text Sources
Molecular Biology Databases
Research Materials
Miscellaneous

