

Identifying Components in 3D Density Maps of Protein Nanomachines by Multi-scale Segmentation
- PMID: 20556220
- PMCID: PMC2885738
- DOI: 10.1109/LISSA.2009.4906705
Identifying Components in 3D Density Maps of Protein Nanomachines by Multi-scale Segmentation
Abstract
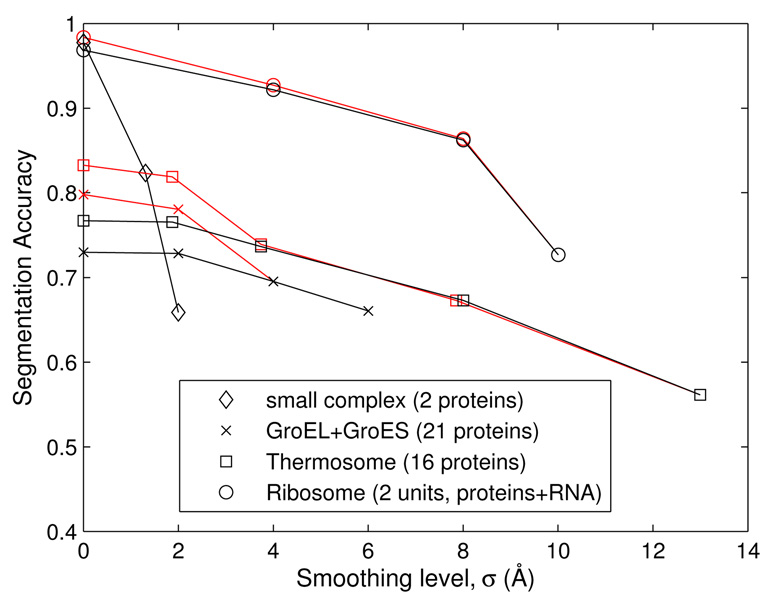
Segmentation of density maps obtained using cryo-electron microscopy (cryo-EM) is a challenging task, and is typically accomplished by time-intensive interactive methods. The goal of segmentation is to identify the regions inside the density map that correspond to individual components. We present a multi-scale segmentation method for accomplishing this task that requires very little user interaction. The method uses the concept of scale space, which is created by convolution of the input density map with a Gaussian filter. The latter process smoothes the density map. The standard deviation of the Gaussian filter is varied, with smaller values corresponding to finer scales and larger values to coarser scales. Each of the maps at different scales is segmented using the watershed method, which is very efficient, completely automatic, and does not require the specification of seed points. Some detail is lost in the smoothing process. A sharpening process reintroduces detail into the segmentation at the coarsest scale by using the segmentations at the finer scales. We apply the method to simulated density maps, where the exact segmentation (or ground truth) is known, and rigorously evaluate the accuracy of the resulting segmentations.
Figures


References
-
- Ludtke SJ, Baldwin PR, Chiu W. EMAN: semiautomated software for high-resolution single-particle reconstructions. Journal of structural biology. 1999 Dec.vol. 128:82–97. - PubMed
-
- Baker ML, Yu Z, Chiu W, Bajaj C. Automated segmentation of molecular subunits in electron cryomicroscopy density maps. Journal of Structural Biology. 2006 Dec.vol. 156:432–441. - PubMed
-
- Shapiro LG, Stockman GC. Computer Vision. Prentice Hall; 2002.
-
- Beucher S, Lantuejoul C. Use of watersheds in contour detection. France: Rennes; 1979.
-
- Najman L, Schmitt M. Geodesic Saliency of Watershed Contours and Hierarchical Segmentation. IEEE Trans. Pattern Anal. Mach. Intell. 1996;vol. 18:1163–1173.
Grants and funding
LinkOut - more resources
Full Text Sources