Review
. 2010 Oct;67(19):3219-40.
doi: 10.1007/s00018-010-0419-2. Epub 2010 Jun 18.

Systems microscopy approaches to understand cancer cell migration and metastasis

Affiliations
Review

Systems microscopy approaches to understand cancer cell migration and metastasis

Sylvia E Le Dévédec et al. Cell Mol Life Sci. 2010 Oct.

Abstract

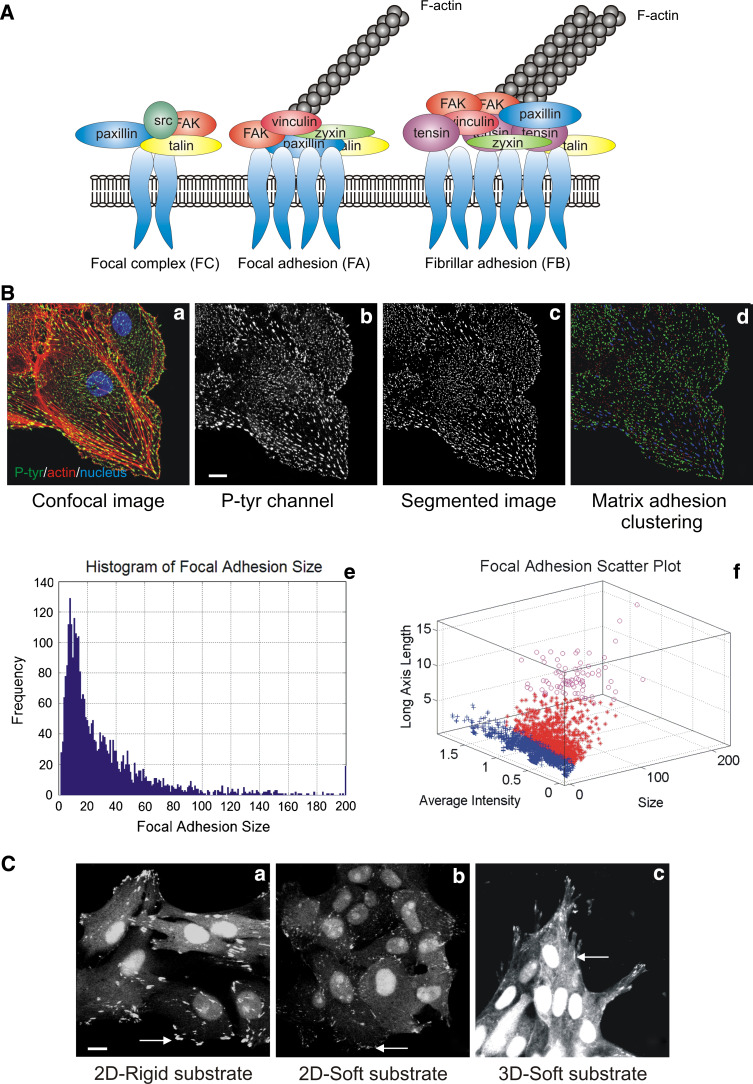
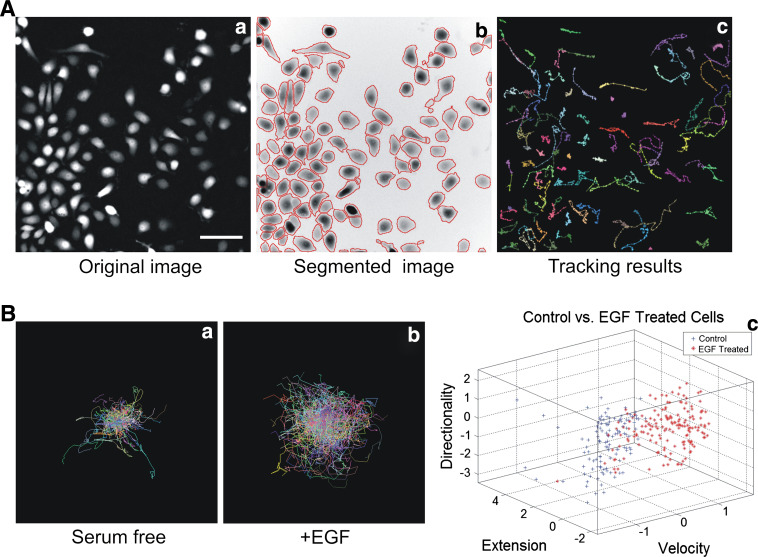
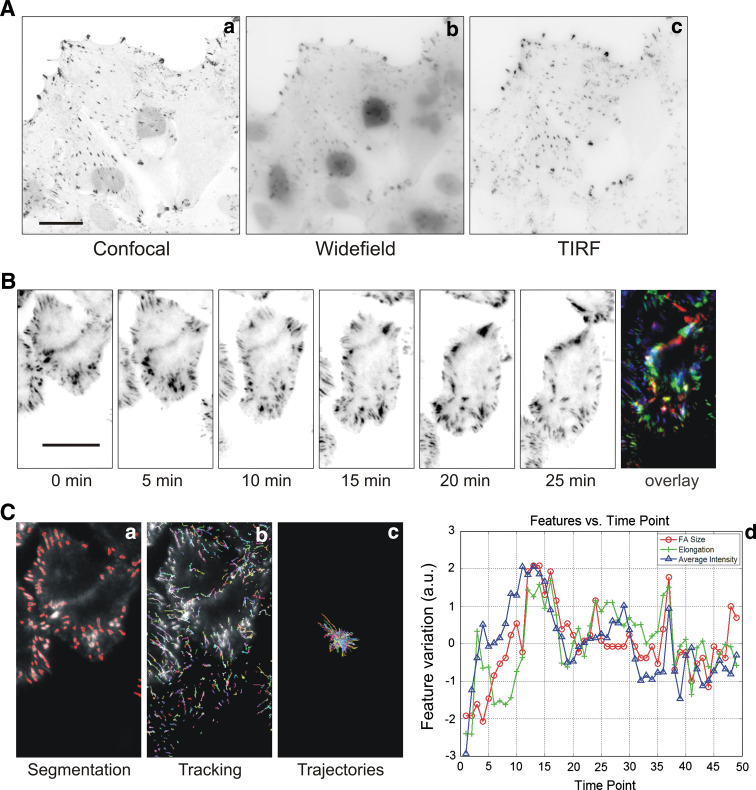
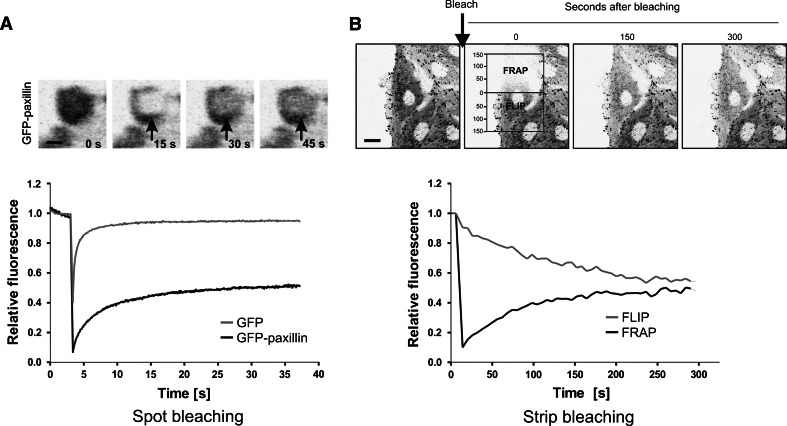
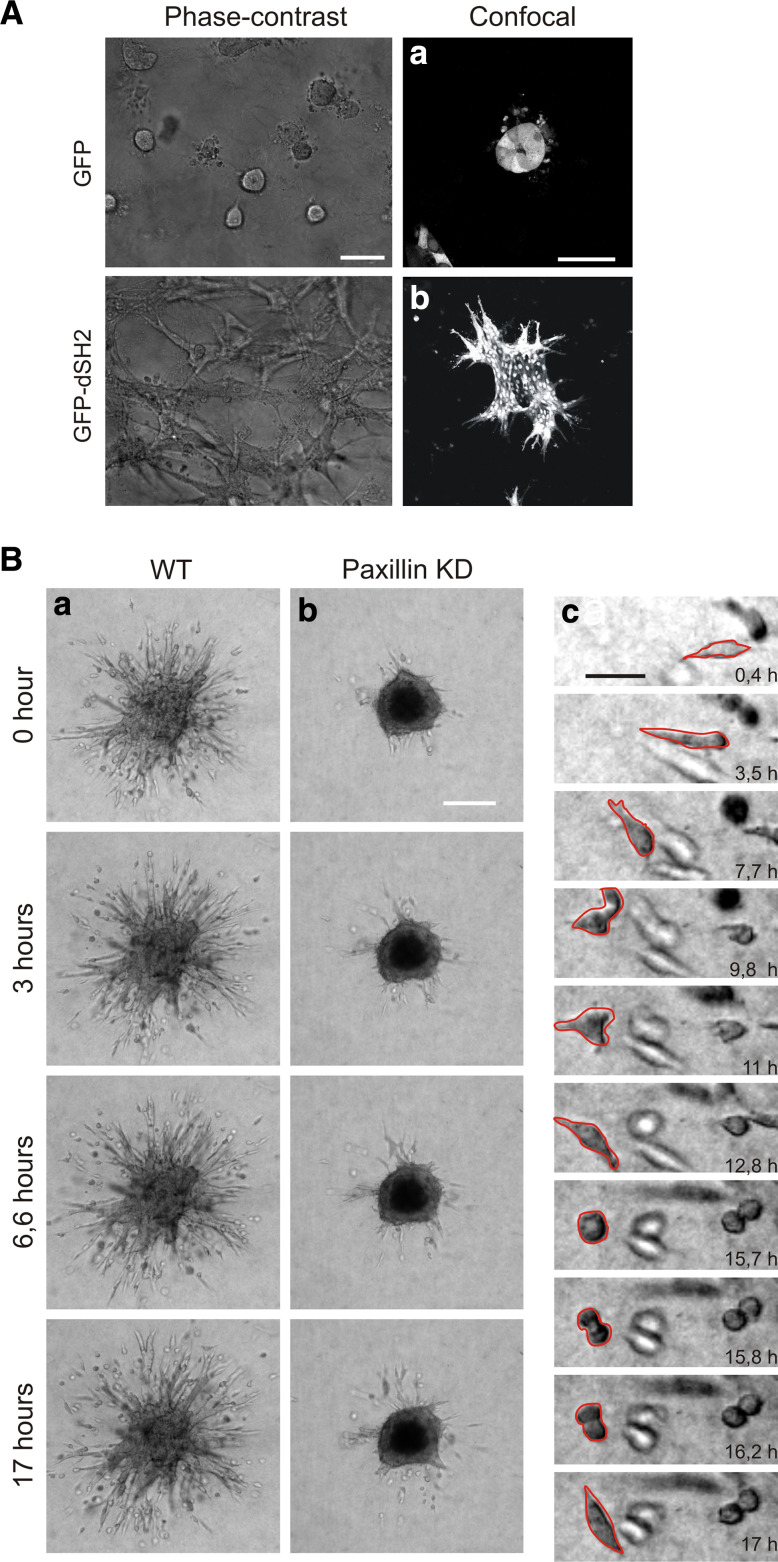
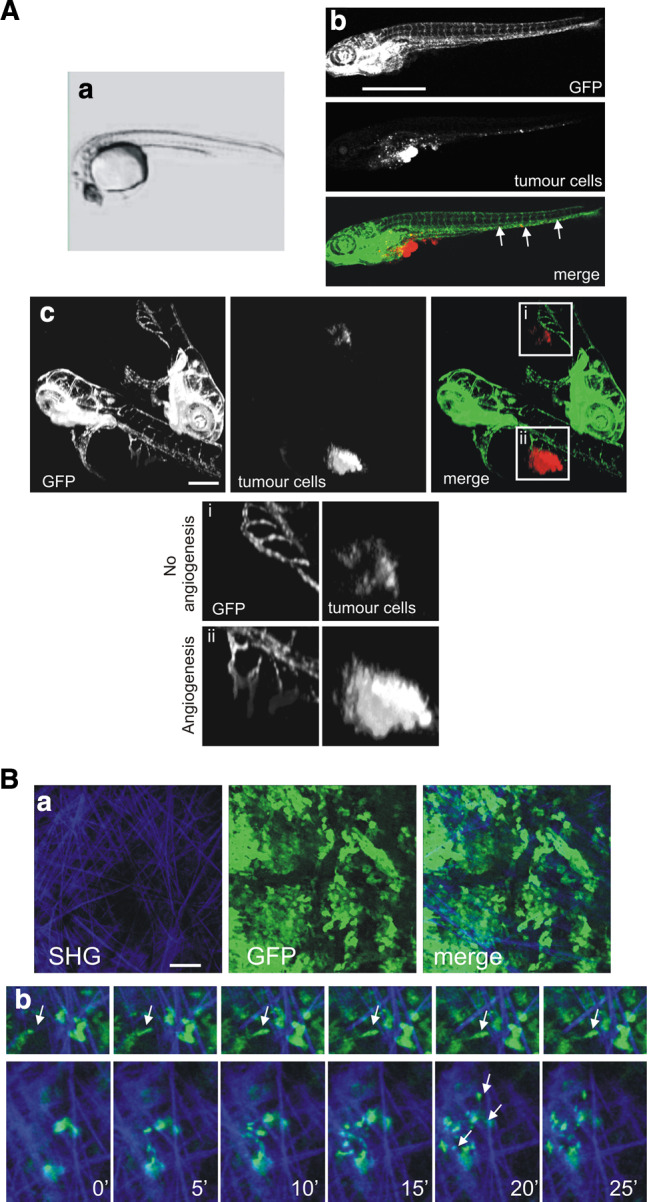
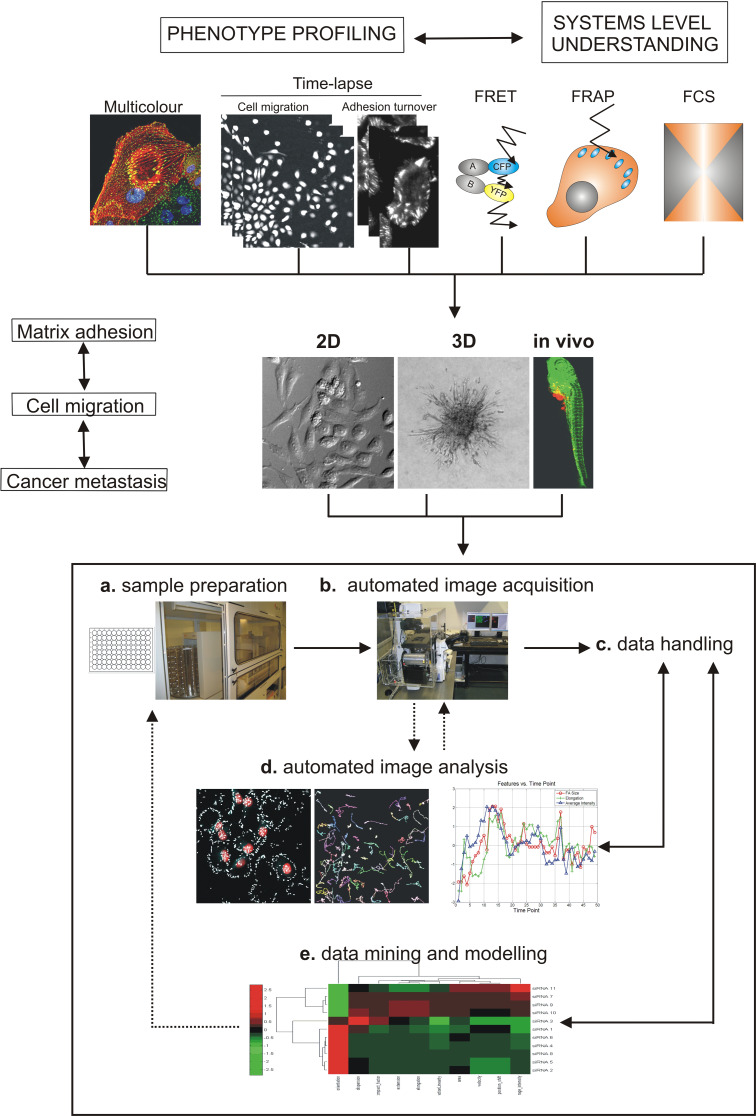
Cell migration is essential in a number of processes, including wound healing, angiogenesis and cancer metastasis. Especially, invasion of cancer cells in the surrounding tissue is a crucial step that requires increased cell motility. Cell migration is a well-orchestrated process that involves the continuous formation and disassembly of matrix adhesions. Those structural anchor points interact with the extra-cellular matrix and also participate in adhesion-dependent signalling. Although these processes are essential for cancer metastasis, little is known about the molecular mechanisms that regulate adhesion dynamics during tumour cell migration. In this review, we provide an overview of recent advanced imaging strategies together with quantitative image analysis that can be implemented to understand the dynamics of matrix adhesions and its molecular components in relation to tumour cell migration. This dynamic cell imaging together with multiparametric image analysis will help in understanding the molecular mechanisms that define cancer cell migration.


Figures

Fig. 1
Fig. 1
Matrix adhesions diversity and composition. a Schematic view of the three classes of matrix adhesions found in adherent cells in vitro. b Image analysis of matrix adhesions. Confocal picture of epithelial cell stained for Hoechst (blue), P-Tyr (green) and F-actin (red) (a); scale bar 10 μm. Confocal picture of focal adhesions only (b). Matrix adhesions segmentation (c) and clustering according to size (d). Distribution of the matrix adhesions according to their size (e) and clustering according to matrix adhesions intensity and length (f). c Matrix adhesions differ in size and shape according to their environment: in 2D rigid versus soft and in 3D; scale bar 10 μm
Fig. 2
Fig. 2
Imaging and analysis of single cell migration. a Epifluorescent imaging and analysis of migrating MTLn3 cells ectopically expressing GFP. Epifluorescent pictures (a) are waterline based segmented (b) and cells are consequently tracked (c); scale bar 50 μm. b Individual cell tracks of MTLn3 stimulated (a) or not by EGF (b) and clustering analysis of both treatments based on directionality, extension and velocity (c)
Fig. 3
Fig. 3
Imaging adhesions by confocal, wide-field and TIRF microscopy. a Z-scan series of the same renal epithelial LLC-PK1 cell overexpressing the reporter construct GFP-dSH2 performed with confocal (a), wide-field (b) and TIRF microscopy (c); scale bar 20 μm. Note the advantage of TIRF microscopy for visualising matrix adhesions. b Analysis of matrix adhesions dynamics with TIRF microscopy. Time lapse of a migrating MTLn3 cell expressing GFP-paxillin and overlay of the different frames to illustrate the focal adhesion turnover; scale bar 10 μm. Note the fast turnover of matrix adhesions in these cells. c Multiparametric analysis of matrix adhesion dynamics. a Matrix adhesion segmentation, b tracking of individual matrix adhesions, c plot of all individual matrix adhesion trajectories and lifetime, d example of possible plot of different features (FA size, elongation and intensity) of an individual matrix adhesion over the time. The different features are normalised so that the data distribution is scaled to 1 and the average of all features are shifted to zero. A FA size of −2 indicates that the FA size in this frame is smaller than its average size by 2 in the normalised feature space
Fig. 4
Fig. 4
Studying dynamics of matrix adhesion associated proteins by FRAP analysis. a Time lapse of a typical spot-bleaching experiment. A region of interest within a focal adhesion is defined, bleached with a high power laser intensity and subsequently followed over the time until fluorescence intensity reached a steady state. Fluorescence recovery over the time is plotted. Scale bar 1 μm. b Combined FLIP–FRAP experiment is performed over the whole cell which allows analysis of several adhesions in the same time. Average loss in fluorescence and recovery of fluorescence are plotted over the time. Scale bar 10 μm
Fig. 5
Fig. 5
Imaging adhesion and cell migration in 3D culture system in vitro. a Phase contrast (scale bar 100 μm) and confocal pictures (scale bar 50 μm) of tubulogenesis assays conducted with LLC-PK1 cells overexpressing either GFP alone (a) or GFP-dSH2 (b) in Matrigel-collagen gels. b Time lapse series (of 17 h) of 4T1 mouse mammary carcinoma cells control (a) and paxillin knockdown (b) invading 3D collagen gels (made with the help of H. Truong). Scale bar 200 μm. c Detailed time lapse serie of one migrating 4T1 control cell. Scale bar 50 μm
Fig. 6
Fig. 6
Imaging tumour cell migration in vivo. a Migration and cell mass formation of human tumour cells injected into the yolk sac of zebrafish embryos (Pictures obtained from V. Gothra, S. He, BE Snaar-Jagalska, and EHJ Danen). a Phase contrast overview picture of the yolk sac of zebrafish embryos. b An example of spreading of 4T1 breast tumour cells (red) in transgenic zebrafish embryos expressing GFP under an endothelial promotor. Cells invaded, migrated and formed distant micrometastases, which are indicated with arrows. Scale bar 1 mm. c Two examples of zebrafishes without angiogenesis (i) and with angiogenesis formed through the tumour cell mass formed (ii). Scale bar 200 μm. b Rat mammary carcinoma MTLn3 cells in orthotopic mammary tumours move show high motility in vivo with an amoeboid. a Multiphoton microscopy shows tumour mass (green) and extra cellular matrix visualised by second harmonic generation (blue). Scale bar 100 μm. b Time-lapse images of MTLn3 carcinoma cells as they extend protrusions along ECM fibres (arrowheads). Images shown are at 5-min intervals
Fig. 7
Fig. 7
Steps for high content systems microscopy approach to understand cancer metastasis. Overview of imaging techniques that allow the phenotypic profiling of proteomics and cellomics (fixed multicolour and time-lapse) and the understanding at systems level (FRET, FRAP and FCS). To enhance our understanding of cancer metastasis, the high-throughput fluorescence microscopy should be applied in 2D, 3D and finally in vivo. a Sample preparation including cell transfection, exposure or immunostaining is nowadays conducted in multi-well dishes using robotics. b Automated image acquisition of fixed or living cells is done using automated microscopes (see Table 1, Available High Content Screening (HCS) instrumentation in [157]). Images can be acquired using different fluorescence microscopy techniques (e.g. fixed multicolour, time-lapse, FRET, FRAP, FCS. c Image data storage requires specialised software and hardware for data handling. d Automated image analysis which needs to be adapted or developed for each assay and is currently a challenge in HTS field. e Another big challenge in the field is the data mining and modelling which requires different disciplines such as statistics and bioinformatics (see Table 2 and available HCS informatics tools in [157]) (adapted from [142])

Similar articles

Cited by

References

    1. Friedl P, Gilmour D. Collective cell migration in morphogenesis, regeneration and cancer. Nat Rev Mol Cell Biol. 2009;10:445–457. doi: 10.1038/nrm2720. - DOI - PubMed
    1. Ridley AJ, Schwartz MA, Burridge K, Firtel RA, Ginsberg MH, Borisy G, Parsons JT, Horwitz AR. Cell migration: integrating signals from front to back. Science. 2003;302:1704–1709. doi: 10.1126/science.1092053. - DOI - PubMed
    1. Linder S. The matrix corroded: podosomes and invadopodia in extracellular matrix degradation. Trends Cell Biol. 2007;17:107–117. doi: 10.1016/j.tcb.2007.01.002. - DOI - PubMed
    1. Destaing O, Saltel F, Geminard JC, Jurdic P, Bard F. Podosomes display actin turnover and dynamic self-organization in osteoclasts expressing actin-green fluorescent protein. Mol Biol Cell. 2003;14:407–416. doi: 10.1091/mbc.E02-07-0389. - DOI - PMC - PubMed
    1. Yamaguchi H, Lorenz M, Kempiak S, Sarmiento C, Coniglio S, Symons M, Segall J, Eddy R, Miki H, Takenawa T, Condeelis J. Molecular mechanisms of invadopodium formation: the role of the N-WASP-Arp2/3 complex pathway and cofilin. J Cell Biol. 2005;168:441–452. doi: 10.1083/jcb.200407076. - DOI - PMC - PubMed

Publication types

LinkOut - more resources