. 2010 Jun 17:10.1007/s10827-010-0252-5.
doi: 10.1007/s10827-010-0252-5. Online ahead of print.

Comparative power spectral analysis of simultaneous electroencephalographic and magnetoencephalographic recordings in humans suggests non-resistive extracellular media : EEG and MEG power spectra

Affiliations

Comparative power spectral analysis of simultaneous electroencephalographic and magnetoencephalographic recordings in humans suggests non-resistive extracellular media : EEG and MEG power spectra

Nima Dehghani et al. J Comput Neurosci. .

Abstract

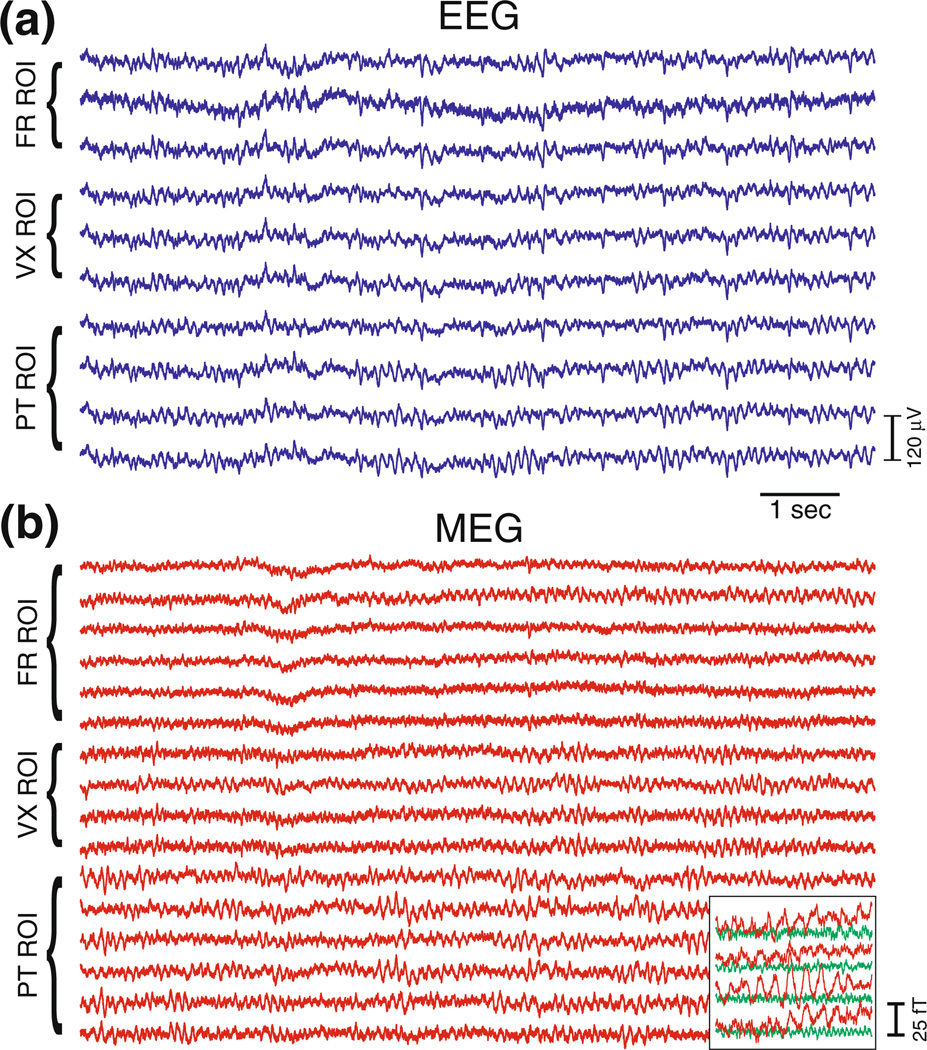
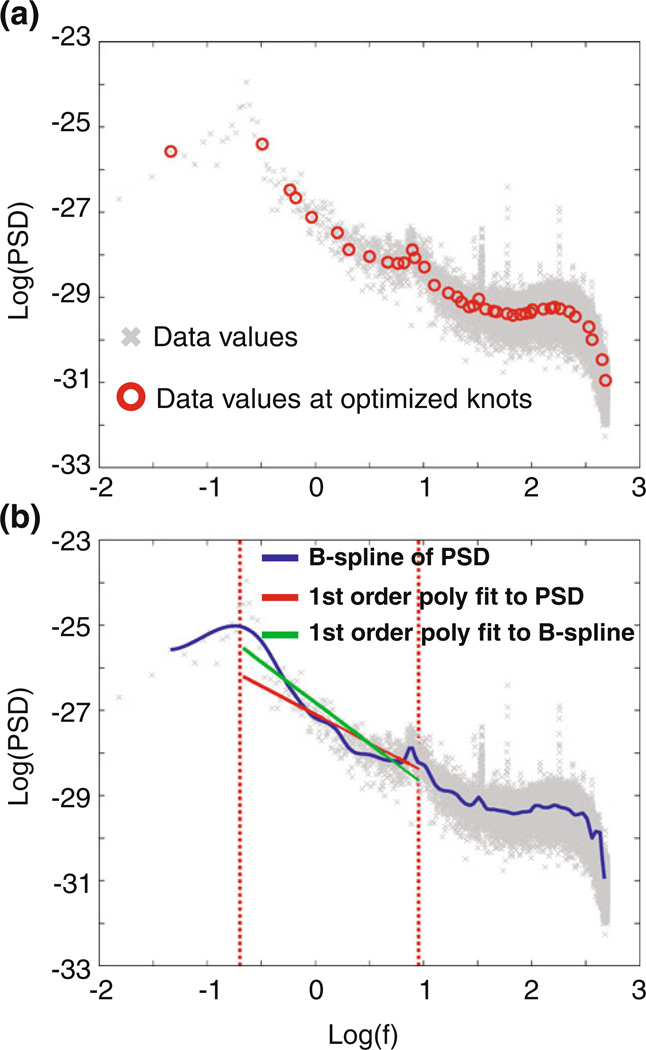
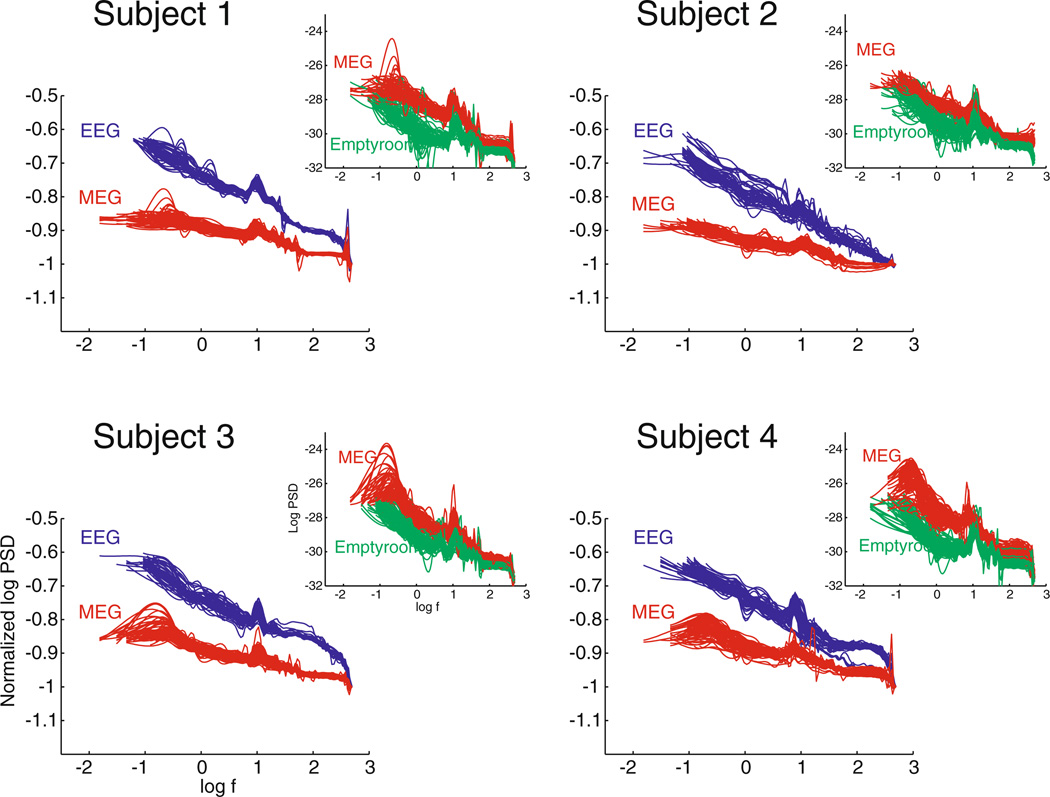
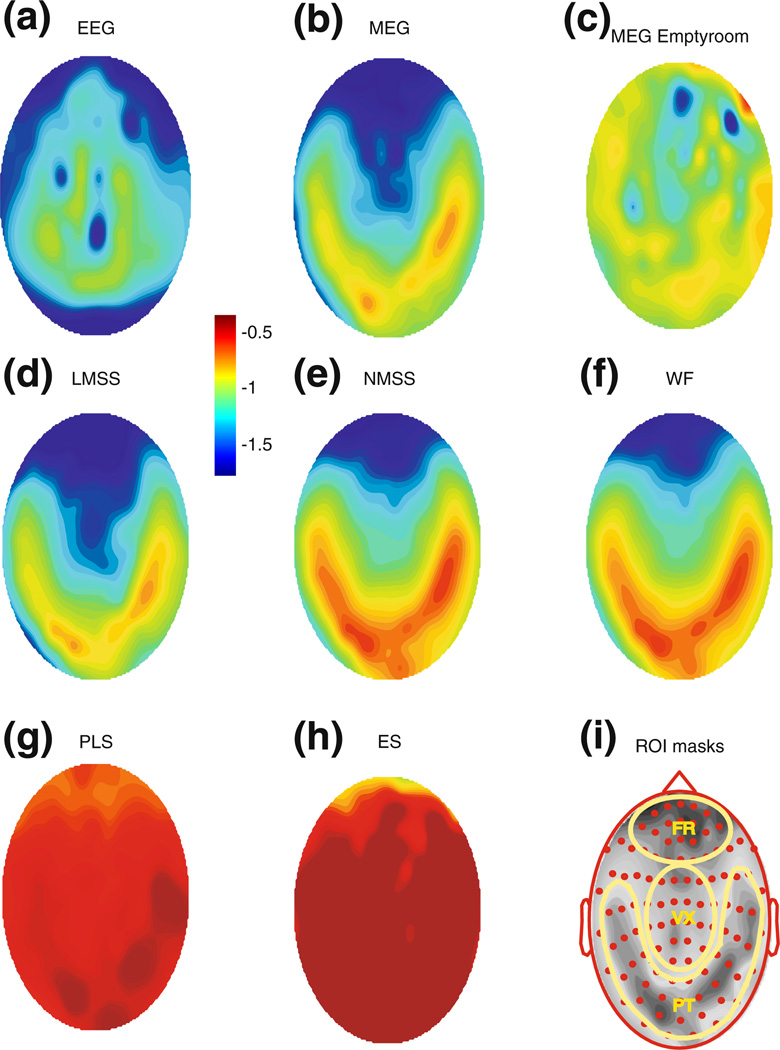
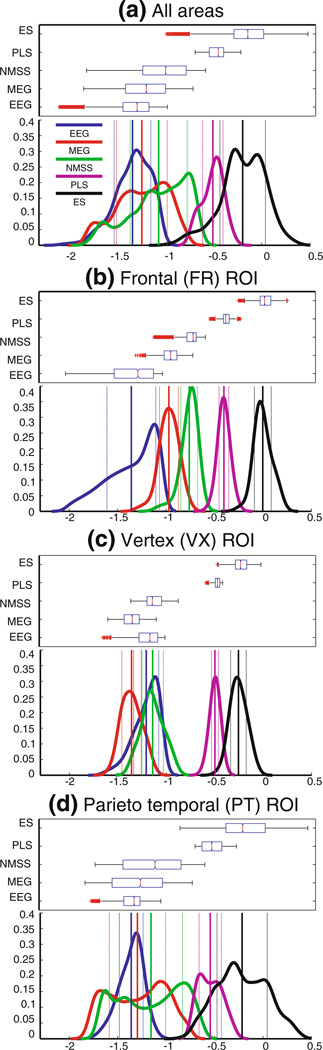
The resistive or non-resistive nature of the extracellular space in the brain is still debated, and is an important issue for correctly modeling extracellular potentials. Here, we first show theoretically that if the medium is resistive, the frequency scaling should be the same for electroencephalogram (EEG) and magnetoencephalogram (MEG) signals at low frequencies (<10 Hz). To test this prediction, we analyzed the spectrum of simultaneous EEG and MEG measurements in four human subjects. The frequency scaling of EEG displays coherent variations across the brain, in general between 1/f and 1/f (2). In a given region, although the variability of the frequency scaling exponent was higher for MEG compared to EEG, both signals consistently scale with a different exponent. In some cases, the scaling was similar, but only when the signal-to-noise ratio of the MEG was low. Several methods of noise correction for environmental and instrumental noise were tested, and they all increased the difference between EEG and MEG scaling. In conclusion, there is a significant difference in frequency scaling between EEG and MEG, which can be explained if the extracellular medium (including other layers such as dura matter and skull) is globally non-resistive.


Figures

Fig. 1
Fig. 1
Simultaneous EEG and MEG recordings in an awake human subject. This example shows a sample of channels from MEG/EEG after ECG noise removal. Labels refer to ROIs as defined in methods (also see Fig. 4). FR frontal, VX vertex, PT parietotemporal. These sample channels were selected to represent both right and left hemispheres in a symmetrical fashion. Inset: magnification of the MEG (red) and “empty-room” (green) signals superimposed from four sample channels. All traces are before any noise correction, but after ECG decontamination
Fig. 2
Fig. 2
a log–log scale of the PSD vs frequency of a sample MEG sensor along with the corresponding log(PSD) values (shown as circles) at optimized knots in log-scale. b 1st degree Polynomial fit on B-spline curve effectively captures properties of the signal better than simple polynomial fit and avoids the 10 Hz peak. The fit was limited between 0.1 to 10 Hz excluding the boundaries. This limits the fit approximation to the next limiting optimized knots (between 0.1 and 0.2 to between 9 and 10 Hz) to avoid the peaks at alpha and low frequencies (shown by vertical dotted lines)
Fig. 3
Fig. 3
B-spline fits of EEG awake and MEG awake (prior to noise correction) recordings from all four subjects. Each line refers to the fit of one sensor in log(PSD)-log(frequency) scale. For the ease of visual comparison of the frequency scaling exponent, log(PSD) values are normalized to their value at the maximum frequency. Each panel represents the data related to one of our four subjects. These plots show a clear distinction between the frequency scaling of EEG and MEG. Insets show the comparison between MEG awake (prior to noise correction) and MEG empty-room recordings (not normalized). Note that the empty-room scales similar to the MEG signal, but in general EEG and MEG scale differently
Fig. 4
Fig. 4
Topographical representation of frequency scaling exponent averaged across four subjects. (a) EEG awake. (b) MEG awake. (c) MEG empty-room. (d), (e) MEG after spectral subtraction of the empty-room noise using linear (LMSS) and non-linear (NMSS) methods respectively. (f) MEG spectral enhancement using Wiener filtering (WF). (g) MEG, partial least square (PLS) approximation of non-noisy spectrum. (h) Exponent subtraction (the exponent represented is the value of the frequency scaling exponent calculated for MEG signals, subtracted from the scaling exponent calculated from the corresponding emptyroom signals). (i) Spatial location of ROI masks (shown in yellow). FR covers the Frontal, VX covers Vertex and PT spans Parietotemporal. Dots show spatial arrangement of 102 MEG SQUID sensor triplets. The background gray-scale figure is same as the one in panel (b). Note that panels (a) through (h) use the same color scaling
Fig. 5
Fig. 5
Statistical comparison of EEG vs.MEG frequency scaling exponent for all regions (a) and different ROI masks (b, c & d). In each panel, a box-plot on top is accompanied by a nonparametric distribution function in the bottom. In the top graph, the box has lines at the lower quartile, median (red), and upper quartile values. Smallest and biggest non-outlier observations (1.5 times the interquartile range IRQ) are shown as whiskers. Outliers are data with values beyond the ends of the whiskers and are displayed with a red plus sign. In the bottom graph, a Nonparametric density function shows the distribution of EEG, MEG and empty-room-corrected MEG frequency scaling exponents (note that LMSS and WF are not shown here; see the text for description.). Thick and thin vertical lines show the mean and mean ± std for each probability density function (pdf)

References

    1. Abd El-Fattah MA, Dessouky MI, Diab SM, Abd El-samie FE. Speech enhancement using an adaptive Wiener filtering approach. Progress in Electromagnetics Research. 2008;4:167–184.
    1. Abdi H. Partial least square regression, projection on latent structure regression, PLS-regression. Computational Statistics. 2010;2:97–106.
    1. Ahlfors SP, Han J, Lin FH, Witzel T, Belliveau JW, Hämäläinen MS, et al. Cancellation of EEG and MEG signals generated by extended and distributed sources. Human Brain Mapping. 2010;31:140–149. - PMC - PubMed
    1. Bédard C, Destexhe A. Macroscopic models of local field potentials and the apparent 1/f noise in brain activity. Biophysical Journal. 2009;96:2589–2603. - PMC - PubMed
    1. Bédard C, Kröger H, Destexhe A. Modeling extracellular field potentials and the frequency-filtering properties of extracellular space. Biophysical Journal. 2004;86:1829–1842. - PMC - PubMed

LinkOut - more resources