

3D finite compartment modeling of formation and healing of bruises may identify methods for age determination of bruises
- PMID: 20556661
- PMCID: PMC2926474
- DOI: 10.1007/s11517-010-0647-5
3D finite compartment modeling of formation and healing of bruises may identify methods for age determination of bruises
Abstract
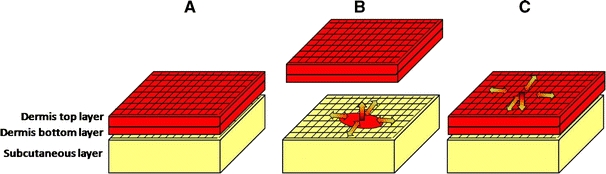
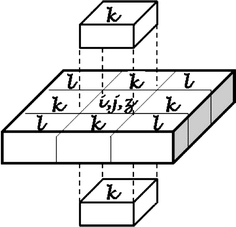
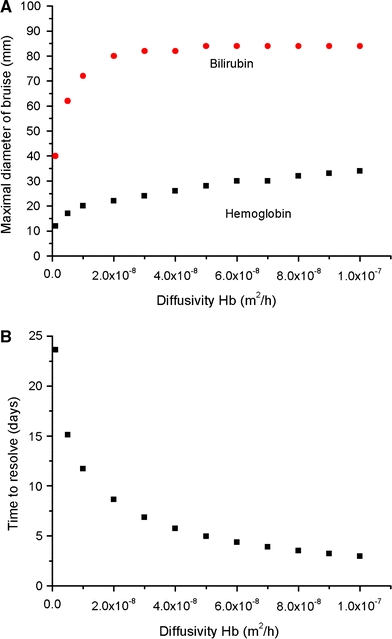
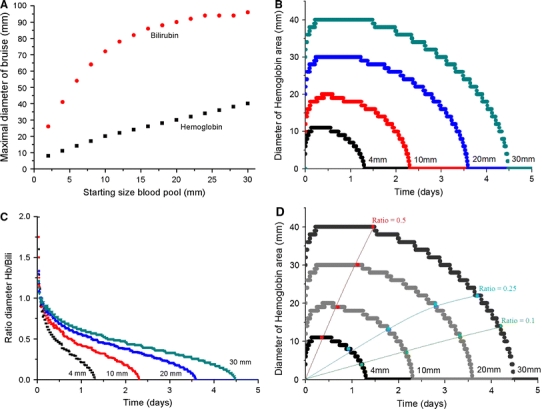
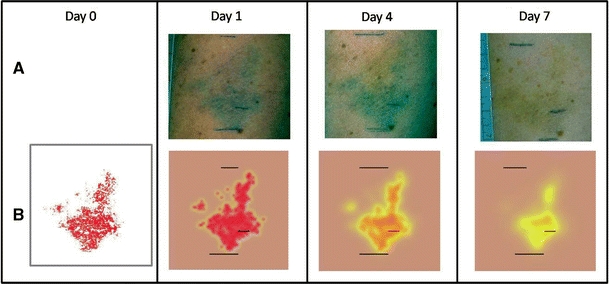
Simulating the spatial and temporal behavior of bruises may identify methods that allow accurate age determination of bruises to assess child abuse. We developed a numerical 3D model to simulate the spatial kinetics of hemoglobin and bilirubin during the formation and healing of bruises. Using this model, we studied how skin thickness, bruise diameter and diffusivities affect the formation and healing of circular symmetric bruises and compared a simulated bruise with a natural inhomogeneous bruise. Healing is faster for smaller bruises in thinner and less dense skin. The simulated and natural bruises showed similar spatial and temporal dynamics. The different spatio-temporal dynamics of hemoglobin and bilirubin allows age determination of model bruises. Combining our model predictions with individual natural bruises may allow optimizing our model parameters. It may particularly identify methods for more accurate age determination than currently possible to aid the assessment of child abuse.
Figures


Similar articles
-
How the blood pool properties at onset affect the temporal behavior of simulated bruises.Med Biol Eng Comput. 2012 Feb;50(2):165-71. doi: 10.1007/s11517-012-0860-5. Epub 2012 Jan 20. Med Biol Eng Comput. 2012. PMID: 22261914 Free PMC article.
-
Can color inhomogeneity of bruises be used to establish their age?J Biophotonics. 2011 Oct;4(10):759-67. doi: 10.1002/jbio.201100021. Epub 2011 May 19. J Biophotonics. 2011. PMID: 21595043
-
Use of reflectance spectrophotometry and colorimetry in a general linear model for the determination of the age of bruises.Forensic Sci Med Pathol. 2010 Dec;6(4):275-81. doi: 10.1007/s12024-010-9171-z. Epub 2010 Jun 20. Forensic Sci Med Pathol. 2010. PMID: 20563889
-
The ageing of bruises: a review and study of the colour changes with time.Forensic Sci Int. 1991 Sep;50(2):227-38. doi: 10.1016/0379-0738(91)90154-b. Forensic Sci Int. 1991. PMID: 1748358 Review.
-
Systematic reviews of bruising in relation to child abuse-what have we learnt: an overview of review updates.Evid Based Child Health. 2013 Mar 7;8(2):255-63. doi: 10.1002/ebch.1909. Evid Based Child Health. 2013. PMID: 23877882 Review.
Cited by
-
Reaction-diffusion modelling for microphysiometry on cellular specimens.Med Biol Eng Comput. 2013 Apr;51(4):387-95. doi: 10.1007/s11517-012-1007-4. Epub 2012 Dec 1. Med Biol Eng Comput. 2013. PMID: 23203682
-
Hyperspectral imaging to accurately segment skin erythema and hyperpigmentation in cutaneous chronic graft-versus-host disease.J Biophotonics. 2023 Jul;16(7):e202300009. doi: 10.1002/jbio.202300009. Epub 2023 Apr 10. J Biophotonics. 2023. PMID: 36942511 Free PMC article.
-
How the blood pool properties at onset affect the temporal behavior of simulated bruises.Med Biol Eng Comput. 2012 Feb;50(2):165-71. doi: 10.1007/s11517-012-0860-5. Epub 2012 Jan 20. Med Biol Eng Comput. 2012. PMID: 22261914 Free PMC article.
References
-
- Welch AJ et al (1995) Definitions and overview of tissue optics. In: Welch AJ, Van Gemert MJ (eds) Optical-thermal response of laser-irradiated tissue. Plenum Press, New York
-
- Beutler E, et al. Williams hematology. New York: McGraw-Hill Inc; 1995.
Publication types
MeSH terms
Substances
LinkOut - more resources
Full Text Sources
Other Literature Sources
Medical
