. 2010 Jul 15;82(14):6224-9.
doi: 10.1021/ac101041s.

Convex lens-induced confinement for imaging single molecules

Affiliations

Convex lens-induced confinement for imaging single molecules

Sabrina R Leslie et al. Anal Chem. .

Abstract

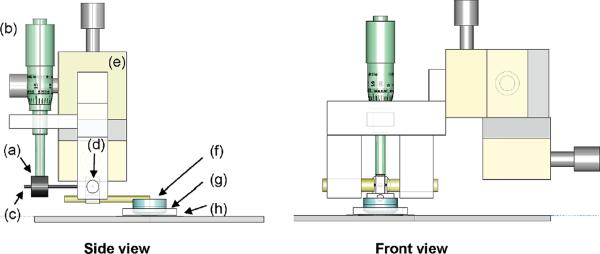
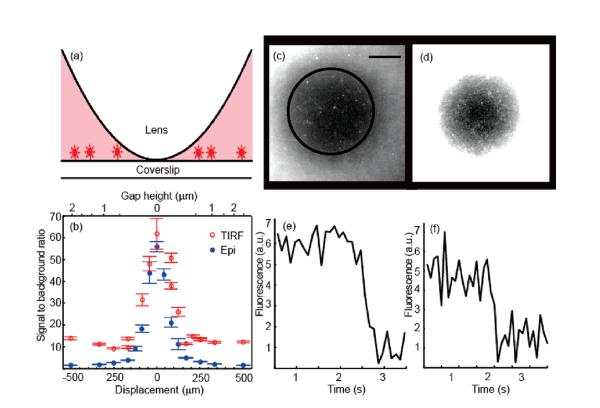
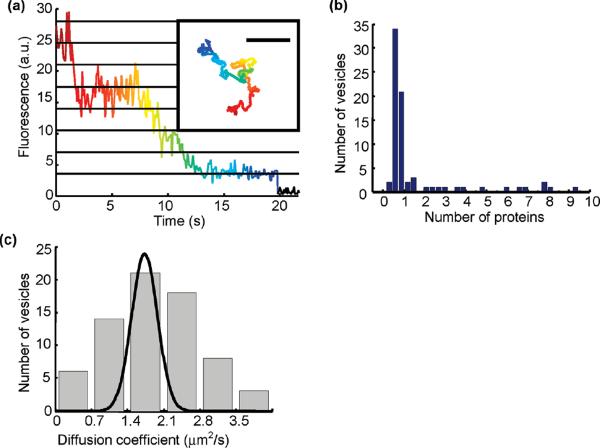
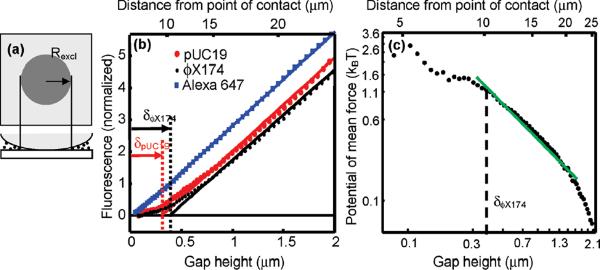
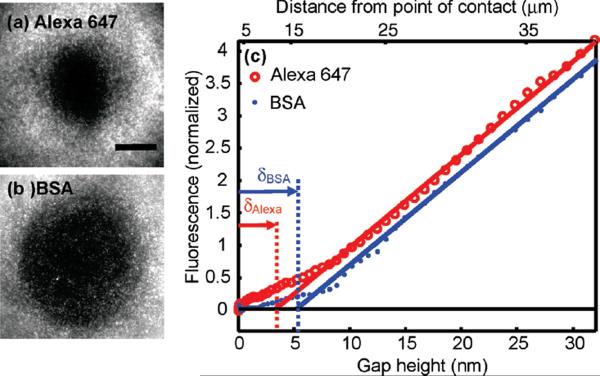
Fluorescence imaging is used to study the dynamics of a wide variety of single molecules in solution or attached to a surface. Two key challenges in this pursuit are (1) to image immobilized single molecules in the presence of a high level of fluorescent background and (2) to image freely diffusing single molecules for long times. Strategies that perform well by one measure often perform poorly by the other. Here, we present a simple modification to a wide-field fluorescence microscope that addresses both challenges and dramatically improves single-molecule imaging. The technique of convex lens-induced confinement (CLIC) restricts molecules to a wedge-shaped gap of nanoscale depth, formed between a plano-convex lens and a planar coverslip. The shallow depth of the imaging volume leads to 20-fold greater rejection of background fluorescence than is achieved with total internal reflection fluorescence (TIRF) imaging. Elimination of out-of-plane diffusion leads to an approximately 10,000-fold longer diffusion-limited observation time per molecule than is achieved with confocal fluorescence correlation spectroscopy. The CLIC system also provides a new means to determine molecular size. The CLIC system does not require any nanofabrication, nor any custom optics, electronics, or computer control.


Figures

Figure 1
Figure 1
Schematic of the CLIC device. The side view and front view show (a) counterweight, (b) micrometer, (c) rod, (d) jewel bearing, (e) XYZ translation stage, (f) optical flat and lens, (g) PDMS gasket, and (h) coverslip.
Figure 2
Figure 2
CLIC measurements of immobilized fluorescent objects in the presence of freely diffusing fluorophores. (a) Schematic of sample geometry. (b) Signal-to-background ratio as a function of displacement from the point of contact for surface-immobilized fluorescent polystyrene beads of diameter 36 nm, immersed in 50 nM Alexa 647, λexc = 633 nm. (See Supporting Information Method 1.) CLIC image of surface-tethered DNA oligonucleotides in the presence of (c) 0.2 μM and (d) 2 μM Alexa 647. Scale bar 10 μm. Black contour indicates hCLIC = 2 nm. Different contrasts are applied to the two images to permit visualization of the single molecules near the center and the background in the surround. At 2 μM Alexa 647, single oligos may be detected within a disk of radius r = 16 μm, corresponding to hCLIC = 3 nm, in agreement with the expected detection limit. (e) and (f) photobleaching timetraces of single molecules from (c) and (d), respectively.
Figure 3
Figure 3
Long-time observation of freely diffusing lipid vesicles containing fluorescently labeled BPR. (a) Time-resolved intensity of a tracked vesicle. Each point represents the time average of three consecutive exposures with texp = 0.03 s. The intensity of a single fluorophore was determined from the population average of the amplitude of the last photobleaching event. Horizontal lines indicate integer multiples of the photobleaching step size. Inset: trajectory of the same vesicle, characterized by D = 1.6 ± 0.2 μm2/s (colored according to time). Scale bar 10 μm. (b) Histogram of the number of BPR monomers per vesicle. The BPR count was determined by dividing the initial fluorescence intensity of each vesicle by the intensity of one fluorophore. Most vesicles contain 0 or 1 BPR copies, establishing that the proteins are inserted into the vesicles as monomers. Imperfect measurement of the initial intensity leads to noninteger estimates for the number of proteins at high occupancy. (c) Histogram of diffusion coefficients of 70 vesicles. The gap height was between 450 nm and 1.4 μm. The broad distribution is dominated by heterogeneity in vesicle size. The superimposed Gaussian (unnormalized) shows the per-vesicle uncertainty in D due to finite-length trajectories.
Figure 4
Figure 4
Measuring the size of DNA molecules and the potential of mean force for confinement. (a) Schematic showing a disk centered on the point of contact inside of which molecules are excluded and there is little fluorescence. The molecular diameter is determined from the radius of this excluded region, Rexcl, and the geometry of the lens. (b) Normalized fluorescence profiles of solutions of two lengths of linear DNA, pUC19 (2.7 kbp) and ϕX174 (5.4 kbp) (C0 = 1.4 nM for each), and free Alexa 647 dye (C0 = 50 nM). Linear fits to these profiles are performed at gap heights 0.6 μm < h < 2.7 μm. The fluorescence profiles have been background-subtracted and normalized to have equal slopes in this region. (c) Potential of mean force for confinement of linear ϕX174 DNA, determined from the depth-dependent concentration profile.
Figure 5
Figure 5
Measuring the size of small molecules by their physical exclusion. Fluorescence images of (a) Alexa 647 (d ~ 1 nm; C0 = 50 nM) and (b) BSA labeled with Alexa 488; (d ~ 3 nm; C0 = 300 nM) under the same conditions. The BSA is excluded from a larger region than is the free dye. Scale bar 20 μm. (c) Normalized fluorescence profiles of BSA from (c) and a separate measurement of Alexa 647. Linear fits to I(h) performed at h > 10 nm yield δBSA = 5.2 ± 4 nm and δAlexa= 3.4 ± 3 nm.

References

    1. Selvin PR, Ha T. Single Molecule Techniques: A Laboratory Manual. First ed. Cold Spring Harbor Laboratory Press; New York: 2008.
    1. Levene MJ, Korlach J, Turner SW, Foquet M, Craighead HG, Webb WW. Science. 2003;299:682–686. - PubMed
    1. Axelrod D. Traffic. 2001;2:764–774. - PubMed
    1. Boukobza E, Sonnenfeld A, Haran G. J. Phys. Chem. B. 2001;105:12165–12170.
    1. Okumus B, Arslan S, Fengler SM, Myong S, Ha T. J. Am. Chem. Soc. 2009;131:14844–14844. - PMC - PubMed

Publication types