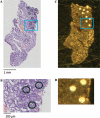
Gastric cancer-specific protein profile identified using endoscopic biopsy samples via MALDI mass spectrometry
- PMID: 20557134
- PMCID: PMC3441055
- DOI: 10.1021/pr100302b
Gastric cancer-specific protein profile identified using endoscopic biopsy samples via MALDI mass spectrometry
Erratum in
- J Proteome Res. 2011 Jan 7;10(1):361
Abstract
To date, proteomic analyses on gastrointestinal cancer tissue samples have been performed using surgical specimens only, which are obtained after a diagnosis is made. To determine if a proteomic signature obtained from endoscopic biopsy samples could be found to assist with diagnosis, frozen endoscopic biopsy samples collected from 63 gastric cancer patients and 43 healthy volunteers were analyzed using matrix-assisted laser desorption/ionization (MALDI) mass spectrometry. A statistical classification model was developed to distinguish tumor from normal tissues using half the samples and validated with the other half. A protein profile was discovered consisting of 73 signals that could classify 32 cancer and 22 normal samples in the validation set with high predictive values (positive and negative predictive values for cancer, 96.8% and 91.3%; sensitivity, 93.8%; specificity, 95.5%). Signals overexpressed in tumors were identified as alpha-defensin-1, alpha-defensin-2, calgranulin A, and calgranulin B. A protein profile was also found to distinguish pathologic stage Ia (pT1N0M0) samples (n = 10) from more advanced stage (Ib or higher) tumors (n = 48). Thus, protein profiles obtained from endoscopic biopsy samples may be useful in assisting with the diagnosis of gastric cancer and, possibly, in identifying early stage disease.
Figures


Similar articles
-
Diagnostic application of serum proteomic patterns in gastric cancer patients by ProteinChip surface-enhanced laser desorption/ionization time-of-flight mass spectrometry.Int J Biol Markers. 2007 Oct-Dec;22(4):281-6. doi: 10.1177/172460080702200407. Int J Biol Markers. 2007. PMID: 18161659
-
Human neutrophil peptides 1-3 as gastric cancer tissue markers measured by MALDI-imaging mass spectrometry: implications for infiltrated neutrophils as a tumor target.Dis Markers. 2012;32(1):21-31. doi: 10.3233/DMA-2012-0857. Dis Markers. 2012. PMID: 22297599 Free PMC article.
-
Oral brush biopsy analysis by matrix assisted laser desorption/ionisation-time of flight mass spectrometry profiling--a pilot study.Oral Oncol. 2011 Apr;47(4):278-81. doi: 10.1016/j.oraloncology.2011.02.005. Epub 2011 Feb 26. Oral Oncol. 2011. PMID: 21354855
-
Peptide and protein imaging mass spectrometry in cancer research.J Proteomics. 2010 Sep 10;73(10):1921-44. doi: 10.1016/j.jprot.2010.05.007. Epub 2010 May 25. J Proteomics. 2010. PMID: 20510389 Review.
-
Proteomic approach to breast cancer.Cancer Control. 2007 Oct;14(4):360-8. doi: 10.1177/107327480701400406. Cancer Control. 2007. PMID: 17914336 Review.
Cited by
-
Protein and lipid MALDI profiles classify breast cancers according to the intrinsic subtype.BMC Cancer. 2011 Oct 27;11:465. doi: 10.1186/1471-2407-11-465. BMC Cancer. 2011. PMID: 22029885 Free PMC article.
-
A Novel Overall Survival Prediction Signature Based on Comprehensive Research in Prostate Cancer Bone Metastases.Front Med (Lausanne). 2022 Jun 16;9:815541. doi: 10.3389/fmed.2022.815541. eCollection 2022. Front Med (Lausanne). 2022. PMID: 35783639 Free PMC article.
-
Analysis of cancer tissues by means of spectroscopic methods.Contemp Oncol (Pozn). 2012;16(4):290-4. doi: 10.5114/wo.2012.30056. Epub 2012 Sep 29. Contemp Oncol (Pozn). 2012. PMID: 23788897 Free PMC article.
-
Macrophage migration inhibitory factor and DJ-1 in gastric cancer: differences between high-incidence and low-incidence areas.Br J Cancer. 2012 Oct 23;107(9):1595-601. doi: 10.1038/bjc.2012.405. Epub 2012 Sep 11. Br J Cancer. 2012. PMID: 22968650 Free PMC article.
-
Discovery and validation of an INflammatory PROtein-driven GAstric cancer Signature (INPROGAS) using antibody microarray-based oncoproteomics.Oncotarget. 2014 Apr 15;5(7):1942-54. doi: 10.18632/oncotarget.1879. Oncotarget. 2014. PMID: 24722433 Free PMC article.
References
-
- Alberts S, Cervantes A, van de Velde C. Gastric cancer: epidemiology, pathology, and treatment. Ann. Oncol. 2003;14:31–6. - PubMed
-
- Carpelan-Holmstrom M, Louhimo J, Stenman UH, Alfthan H, Haglund C. CEA, CA19–9 and CA72–4 improve the diagnostic accuracy in gastrointestinal cancers. Anticancer Res. 2002;22:2311–6. - PubMed
-
- Ohuchi N, Takahashi K, Matoba N, Sato T, Taira Y, Sakai N, Masuda M, Mori S. Comparison of serum assays for TAG-72, CA19–9 and CEA in gastrointestinal carcinoma patients. Jpn. J. Clin. Oncol. 1989;19(3):242–8. - PubMed
-
- Sarela AI, Scott N, Verbeke CS, Wyatt JI, Dexter SP, Sue-Ling HM, Guillou PJ. Diagnostic variation and outcome for high-grade gastric epithelial dysplasia. Arch. Surg. 2005;140(7):644–9. - PubMed
Publication types
MeSH terms
Substances
Grants and funding
LinkOut - more resources
Full Text Sources
Other Literature Sources
Medical

