

Determinants of agreement between the confocal scanning laser tomograph and standardized assessment of glaucomatous progression
- PMID: 20557941
- PMCID: PMC2941775
- DOI: 10.1016/j.ophtha.2010.02.002
Determinants of agreement between the confocal scanning laser tomograph and standardized assessment of glaucomatous progression
Abstract
Purpose: To estimate the agreement of confocal scanning laser tomograph (CSLT), topographic change analysis (TCA) with assessment of stereophotographs, and standard automated perimetry (SAP) for detecting glaucomatous progression and to identify factors associated with agreement between methods.
Design: Observational cohort study.
Participants: We included 246 eyes of 167 glaucoma patients, glaucoma suspects, and ocular hypertensives.
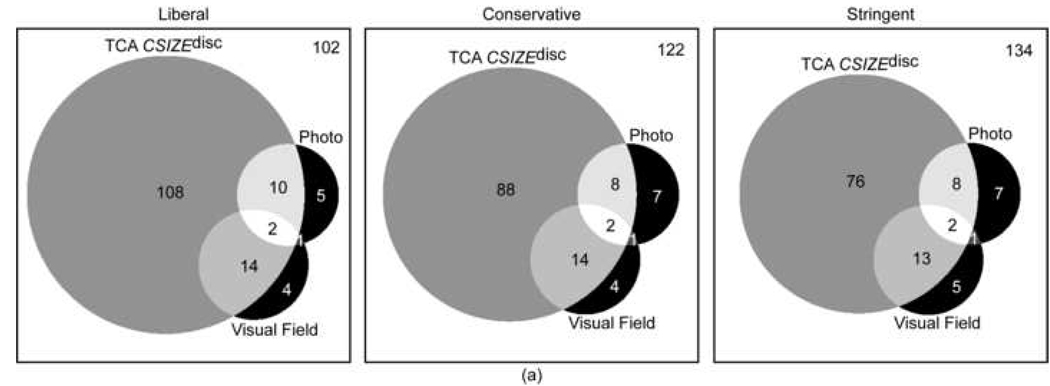
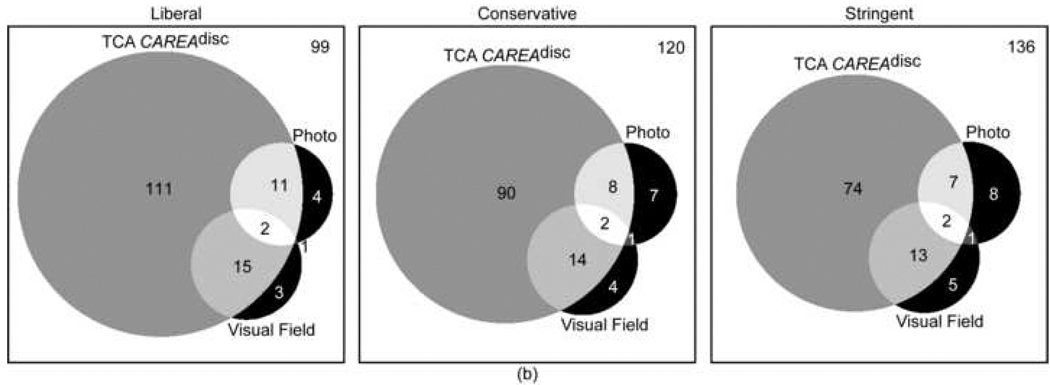
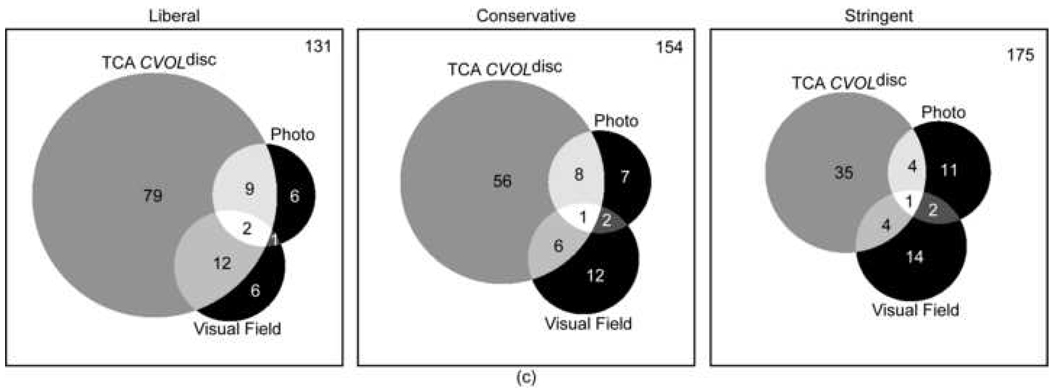
Methods: We included CSLT series (n ≥ 4 tests; mean follow-up, 4 years), stereophotographs, and SAP results in the analysis. The number of progressors by guided progression analysis (GPA, "likely progression"), progressors by masked stereophotographs assessment and progressors by TCA as determined for 3 parameters related to the number of progressed superpixels within the disc margin was determined. Agreement between progression by each TCA parameter, stereophotographs and GPA was assessed using the Kappa test. Analysis of variance with post hoc analysis was applied to identify baseline factors including image quality (standard deviation of the mean topography), disc size and disease severity (pattern standard deviation [PSD] and cup area) associated with agreement/nonagreement between methods.
Main outcome measures: Agreement in assessing glaucomatous progression between the methods including factors associated with agreement/nonagreement between methods.
Results: Agreement between progression by TCA and progression by stereophotographs and/or GPA was generally poor regardless of the TCA parameter and specificity cutoffs applied. For the parameters with the strongest agreement, cluster size in disc (CSIZE(disc)) and cluster area in disc (CAREA(disc)), kappa values were 0.16 (63.9%, agreement on 134 nonprogressing eyes and 23 progressing eyes) and 0.15 (64.1%, agreement on 135 nonprogressing eyes and 22 progressing eyes) at 99% cutoff. Most of the factors evaluated were not significantly associated with agreement/nonagreement between methods (all P > 0.07). However, SAP PSD was greater in the progressors by stereophotography only group compared with the progressors by TCA only group (5.8 ± 4.7 and 2.6 ± 2.2, respectively [P = 0.003] for CSIZE(disc) at 95% specificity and 5.4 ± 4.6 and 2.5 ± 2.3, respectively [P = 0.002] for CAREA(disc) at 99% specificity).
Conclusions: Agreement for detection of longitudinal changes between TCA, stereophotography, and SAP GPA is poor. Progressors by stereophotography only tended to have more advanced disease at baseline than progressors by TCA only.
Copyright © 2010 American Academy of Ophthalmology. Published by Elsevier Inc. All rights reserved.
Figures
References
-
- Tuulonen A, Airaksinen PJ. Initial glaucomatous optic disk and retinal nerve fiber layer abnormalities and their progression. Am J Ophthalmol. 1991;111:485–490. - PubMed
-
- Sommer A, Katz J, Quigley HA, et al. Clinically detectable nerve fiber atrophy precedes the onset of glaucomatous field loss. Arch Ophthalmol. 1991;109:77–83. - PubMed
-
- Heijl A, Leske MC, Bengtsson B, et al. Early Manifest Glaucoma Trial Group. Reduction of intraocular pressure and glaucoma progression: results from the Early Manifest Glaucoma Trial. Arch Ophthalmol. 2002;120:1268–1279. - PubMed
Publication types
MeSH terms
Grants and funding
LinkOut - more resources
Full Text Sources
Medical
Miscellaneous
