

Effects of desferoxamine-induced hypoxia on neuronal human mu-opioid receptor gene expression
- PMID: 20558138
- PMCID: PMC2906625
- DOI: 10.1016/j.bbrc.2010.06.032
Effects of desferoxamine-induced hypoxia on neuronal human mu-opioid receptor gene expression
Abstract
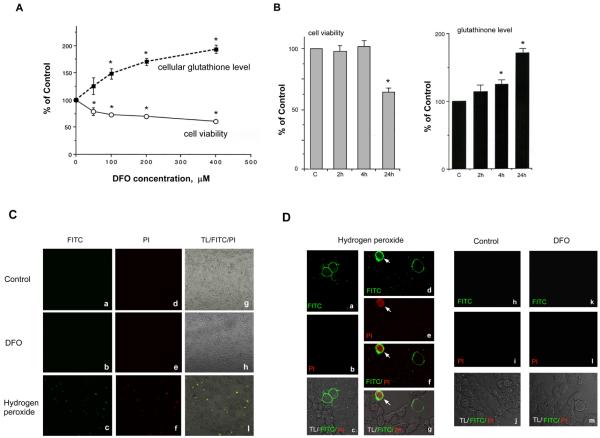
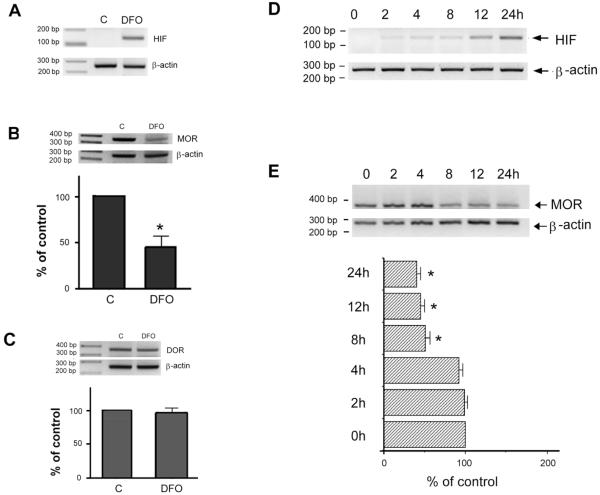
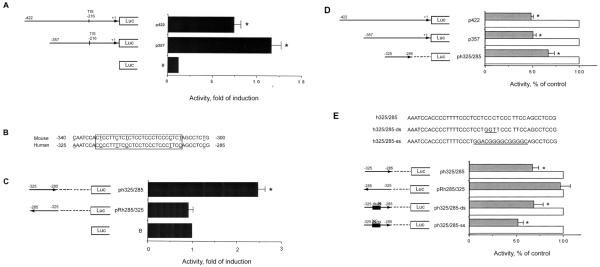
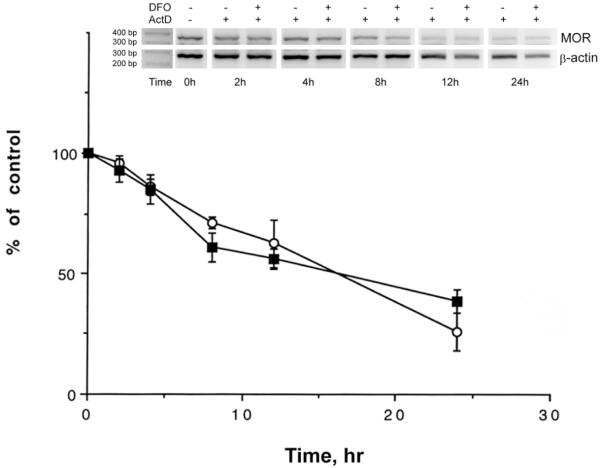
The effect of desferoxamine (DFO)-induced hypoxia on neuronal human mu-opioid receptor (hMOR) gene expression was investigated using NMB cells. DFO decreased cell viability and increased cellular glutathione levels in a dose- and time-dependent manner. Confocal analysis using annexin-V-fluorescein and propidium iodide staining revealed that surviving/attached cells under DFO challenge were morphologically similar to control (vehicle-treated) cells. RT-PCR analysis demonstrated that the hypoxia inducible factor-1alpha (HIF-1alpha) mRNA level was augmented in these surviving neurons. DFO treatment for 8h or longer down-regulated the hMOR message, but not that of the delta-opioid receptor. Functional analysis using luciferase reporter assay showed that the hMOR 5'-regulatory region, from -357bp to translational initiation site (+1), contains the active promoter with an inhibitory region located in the -422 to -357bp region. DFO decreased hMOR promoter activity as compared to control. Mutation analysis suggested the existence of both dsDNA and ssDNA elements, located in a CT-rich region of hMOR, mediating the DFO-response. RT-PCR further revealed that DFO exhibited no effect on hMOR mRNA stability. In conclusion, DFO-induced hypoxia specifically affects neuronal hMOR gene expression at the transcriptional, not post-transcriptional, level.
Copyright 2010 Elsevier Inc. All rights reserved.
Figures
Similar articles
-
Mechanism Governing Human Kappa-Opioid Receptor Expression under Desferrioxamine-Induced Hypoxic Mimic Condition in Neuronal NMB Cells.Int J Mol Sci. 2017 Jan 20;18(1):211. doi: 10.3390/ijms18010211. Int J Mol Sci. 2017. PMID: 28117678 Free PMC article.
-
Desferoxamine preconditioning protects against cerebral ischemia in rats by inducing expressions of hypoxia inducible factor 1 alpha and erythropoietin.Neurosci Bull. 2008 Apr;24(2):89-95. doi: 10.1007/s12264-008-0089-3. Neurosci Bull. 2008. PMID: 18369388 Free PMC article.
-
Effects of trichostatin A on neuronal mu-opioid receptor gene expression.Brain Res. 2008 Dec 30;1246:1-10. doi: 10.1016/j.brainres.2008.09.083. Epub 2008 Oct 11. Brain Res. 2008. PMID: 18950606 Free PMC article.
-
The N-terminally truncated µ3 and µ3-like opioid receptors are transcribed from a novel promoter upstream of exon 2 in the human OPRM1 gene.PLoS One. 2013 Aug 12;8(8):e71024. doi: 10.1371/journal.pone.0071024. eCollection 2013. PLoS One. 2013. PMID: 23951073 Free PMC article.
-
Advances in Hypoxia-Inducible Factor-1α Stabilizer Deferoxamine in Tissue Engineering.Tissue Eng Part B Rev. 2023 Aug;29(4):347-357. doi: 10.1089/ten.TEB.2022.0168. Epub 2023 Feb 1. Tissue Eng Part B Rev. 2023. PMID: 36475887 Review.
Cited by
-
The impact of rumen-protected amino acids on the expression of key- genes involved in the innate immunity of dairy sheep.PLoS One. 2020 May 14;15(5):e0233192. doi: 10.1371/journal.pone.0233192. eCollection 2020. PLoS One. 2020. PMID: 32407360 Free PMC article.
-
Differential regulation of mouse and human Mu opioid receptor gene depends on the single stranded DNA structure of its promoter and α-complex protein 1.Biomed Rep. 2017 May;6(5):532-538. doi: 10.3892/br.2017.877. Epub 2017 Mar 21. Biomed Rep. 2017. PMID: 28529734 Free PMC article.
-
Mechanism Governing Human Kappa-Opioid Receptor Expression under Desferrioxamine-Induced Hypoxic Mimic Condition in Neuronal NMB Cells.Int J Mol Sci. 2017 Jan 20;18(1):211. doi: 10.3390/ijms18010211. Int J Mol Sci. 2017. PMID: 28117678 Free PMC article.
-
RACK1 identified as the PCBP1-interacting protein with a novel functional role on the regulation of human MOR gene expression.J Neurochem. 2013 Feb;124(4):466-77. doi: 10.1111/jnc.12100. Epub 2012 Dec 26. J Neurochem. 2013. PMID: 23173782 Free PMC article.
-
The effect of chronic intermittent hypoxia on respiratory sensitivity to morphine in rats.Sleep Breath. 2017 Mar;21(1):227-233. doi: 10.1007/s11325-016-1448-3. Epub 2017 Jan 3. Sleep Breath. 2017. PMID: 28050773
References
-
- Anderson RN, Smith BL. Deaths: Leading Causes for 2002. Natl Vital Stat. Reports. 2005;53:1–90. - PubMed
-
- Nangaku M, Kojima I, Tanaka T, et al. Novel drugs and the response to hypoxia: HIF stabilizers and prolyl hydroxylase. Recent Pat. Cardiovasc. Drug Discov. 2006;1:129–139. - PubMed
-
- Won SJ, Kim DY, Gwag BJ. Cellular and molecular pathways of ischemic neuronal death. J. Biochem. Mol. Biol. 2002;35:67–86. - PubMed
-
- Kieffer BL, Gaveriaux-Ruff C. Exploring opioid system by gene knockout. Prog. Neurobiol. 2002;66:285–306. - PubMed
Publication types
MeSH terms
Substances
Grants and funding
LinkOut - more resources
Full Text Sources
Research Materials
