Effects of pre- and postnatal exposure to flutamide on connexin 43 expression in testes and ovaries of prepubertal pigs
- PMID: 20558338
- PMCID: PMC3167298
- DOI: 10.4081/ejh.2010.e15
Effects of pre- and postnatal exposure to flutamide on connexin 43 expression in testes and ovaries of prepubertal pigs
Abstract
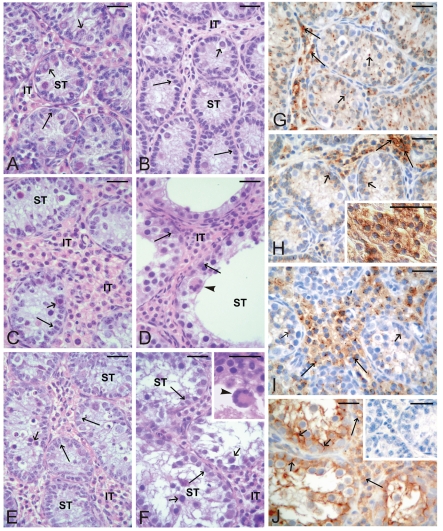
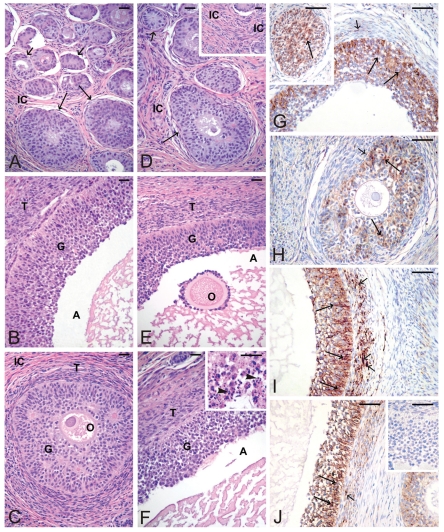
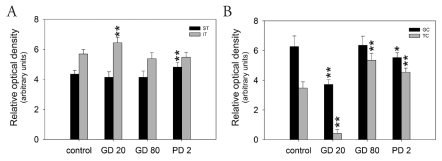
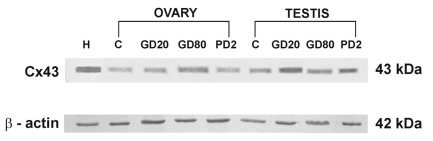
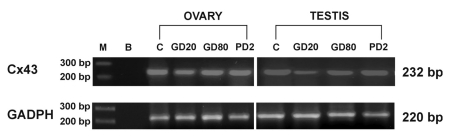
The aim of this study was to show whether the connexin43 (Cx43) expression in gonads is affected by an anti-androgen action. To test this, pigs were prenatally (on gestational days 20-28 and 80-88; GD20, GD80), and postnatally (on days 2-10 after birth; PD2) exposed to flutamide that was given in five doses, every second day and its effect was observed in prepubertal gilts and boars. Morphology and expression of Cx43 was investigated in testes and ovaries by means of routine histology, immunohistochemistry, Western blotting, and RT-PCR, respectively. Qualitative analysis of immunohistochemical staining for Cx43 was confirmed by quantitative image analysis in which the staining intensity was expressed as relative optical density of diaminobenzidine deposits. There were statistically significant differences in Cx43 signal intensity between interstitial tissue of control and GD20 pigs (p less than 0.01), between seminiferous tubules of control and PD2 boars (p less than 0.01), between granulosa cells of preantral follicles of control and GD20 and PD2 pigs (p less than 0.01 and p less than 0.05, respectively), and between theca cells of control and GD80 and PD2 gilts (p less than 0.01). In Western blotting Cx43 appeared as a band of 43 kDa, whereas the size of the PCR-amplified product was 232 bp in all gonad tissue samples. Since we demonstrated changes in gonad morphology and in the expression of Cx43 at the level of protein of prepubertal boars and gilts, it seems possible that flutamide through blocking androgen action, causes delayed gonadal maturation in later postnatal life and, among other factors, may be involved in the regulation of Cx43 gene expression in pig gonads.
Conflict of interest statement
Conflict of interest: the author reports no conflicts of interest.
Figures
Similar articles
-
Connexin 43 gene expression in male and female gonads of porcine offspring following in utero exposure to an anti-androgen, flutamide.Acta Histochem. 2011 Jan;113(1):6-12. doi: 10.1016/j.acthis.2009.07.001. Epub 2009 Oct 22. Acta Histochem. 2011. PMID: 19853283
-
In utero exposure to the anti-androgen flutamide influences connexin 43 and β-catenin expression in porcine fetal gonads.Domest Anim Endocrinol. 2013 May;44(4):185-94. doi: 10.1016/j.domaniend.2013.02.001. Epub 2013 Mar 16. Domest Anim Endocrinol. 2013. PMID: 23571006
-
Morphological and functional alterations in adult boar epididymis: Effects of prenatal and postnatal administration of flutamide.Acta Vet Scand. 2011 Feb 22;53(1):12. doi: 10.1186/1751-0147-53-12. Acta Vet Scand. 2011. PMID: 21342526 Free PMC article. Clinical Trial.
-
Differential expression of connexin 43 in adult pig testes during normal spermatogenic cycle and after flutamide treatment.Reprod Domest Anim. 2011 Dec;46(6):1050-60. doi: 10.1111/j.1439-0531.2011.01783.x. Epub 2011 Apr 2. Reprod Domest Anim. 2011. PMID: 21457361 Clinical Trial.
-
Prenatal and neonatal exposure to the antiandrogen flutamide alters connexin 43 gene expression in adult porcine ovary.Domest Anim Endocrinol. 2011 Jan;40(1):19-29. doi: 10.1016/j.domaniend.2010.08.003. Epub 2010 Sep 17. Domest Anim Endocrinol. 2011. PMID: 20961722
Cited by
-
On the future contents of a small journal of histochemistry.Eur J Histochem. 2012 Dec 10;56(4):e51. doi: 10.4081/ejh.2012.e51. Eur J Histochem. 2012. PMID: 23361247 Free PMC article.
-
Connexin 43 expression in the testes during postnatal development of finasteride-treated male rat offspring.Arch Med Sci. 2018 Oct;14(6):1471-1479. doi: 10.5114/aoms.2016.63022. Epub 2016 Nov 15. Arch Med Sci. 2018. PMID: 30393503 Free PMC article.
-
Androgen effect on connexin expression in the mammalian female reproductive system: A systematic review.Bosn J Basic Med Sci. 2020 Aug 3;20(3):293-302. doi: 10.17305/bjbms.2019.4501. Bosn J Basic Med Sci. 2020. PMID: 31881167 Free PMC article.
-
Androgen signaling disruption during fetal and postnatal development affects androgen receptor and connexin 43 expression and distribution in adult boar prostate.Biomed Res Int. 2013;2013:407678. doi: 10.1155/2013/407678. Epub 2013 Sep 17. Biomed Res Int. 2013. PMID: 24151599 Free PMC article.
-
Histochemistry through the years, browsing a long-established journal: novelties in traditional subjects.Eur J Histochem. 2010 Dec 16;54(4):e51. doi: 10.4081/ejh.2010.e51. Eur J Histochem. 2010. PMID: 21263750 Free PMC article.
References
-
- Nicolopoulou-Stamati P, Pitsos MA. The impact of endocrine disrupters on the female reproductive system. Hum Reprod Update. 2001;7:323–30. - PubMed
-
- Edwards TM, Moore BC, Guillette LJ., Jr Reproductive dysgenesis in wildlife: a comparative view. Int J Androl. 2006;29:109–21. - PubMed
-
- Anahara R, Toyama Y, Mori C. Review of the histological effects of the anti-androgen flutamide on mouse testis. Reprod Toxicol. 2008;25:139–43. - PubMed
Publication types
MeSH terms
Substances
LinkOut - more resources
Full Text Sources