. 2010 Sep 1;19(17):3354-71.
doi: 10.1093/hmg/ddq247. Epub 2010 Jun 17.

Mitochondrial calcium uptake capacity as a therapeutic target in the R6/2 mouse model of Huntington's disease

Affiliations

Mitochondrial calcium uptake capacity as a therapeutic target in the R6/2 mouse model of Huntington's disease

Giselle M Perry et al. Hum Mol Genet. .

Abstract

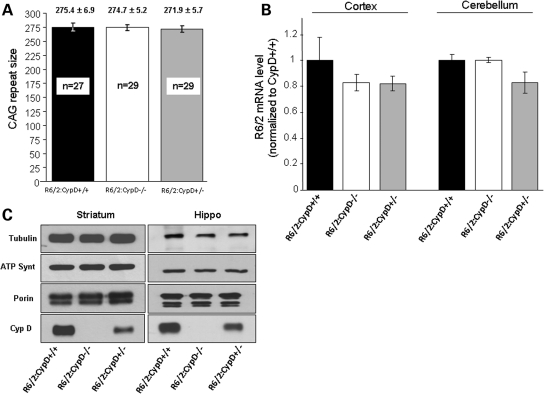
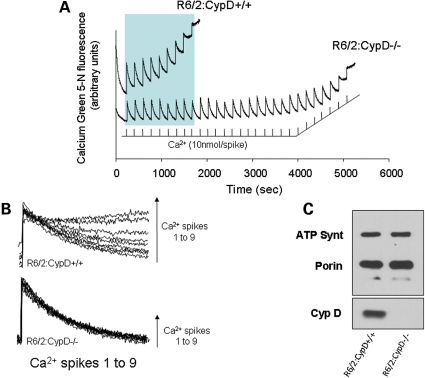
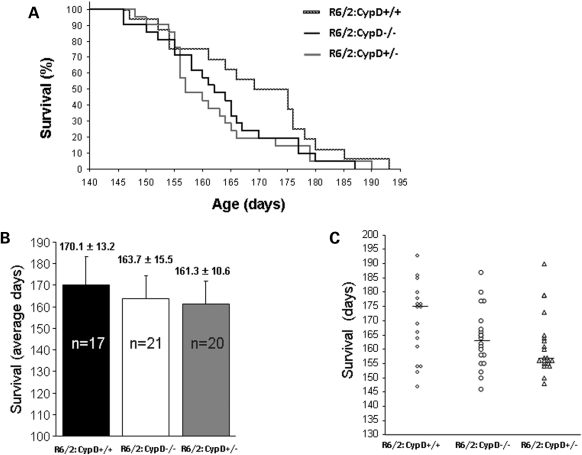
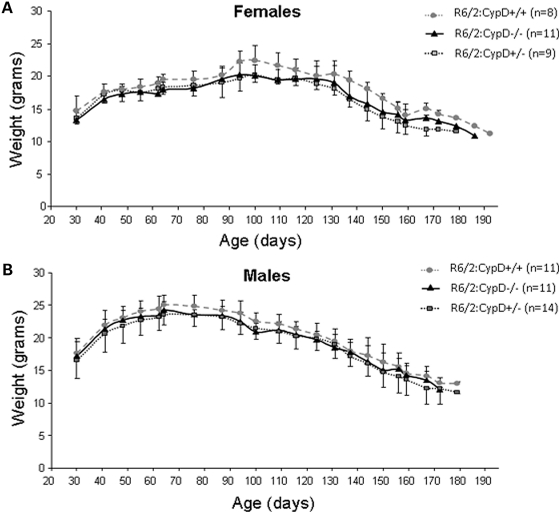
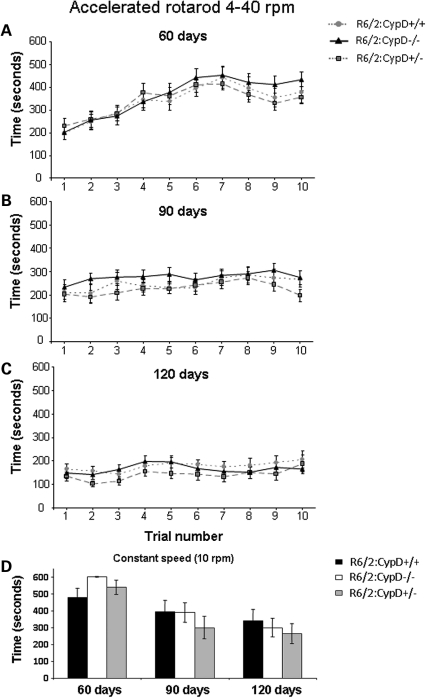
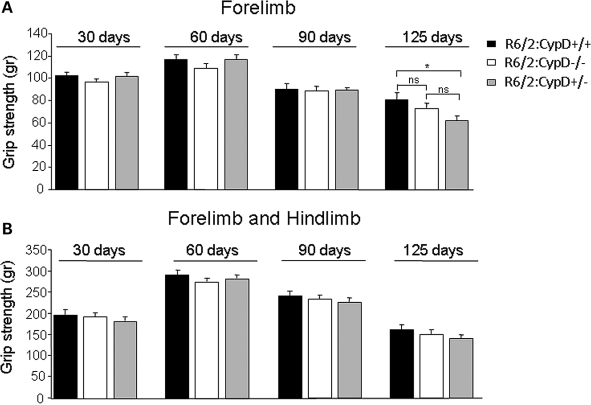
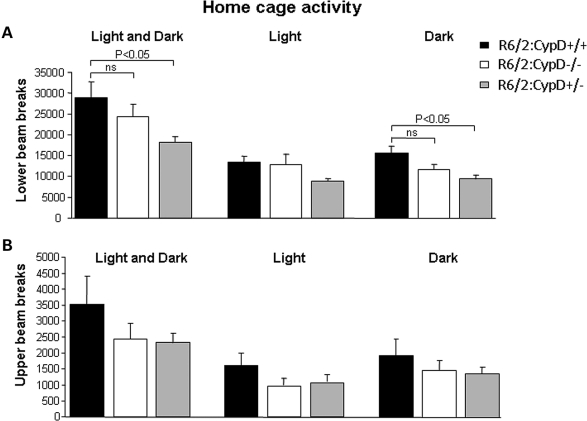
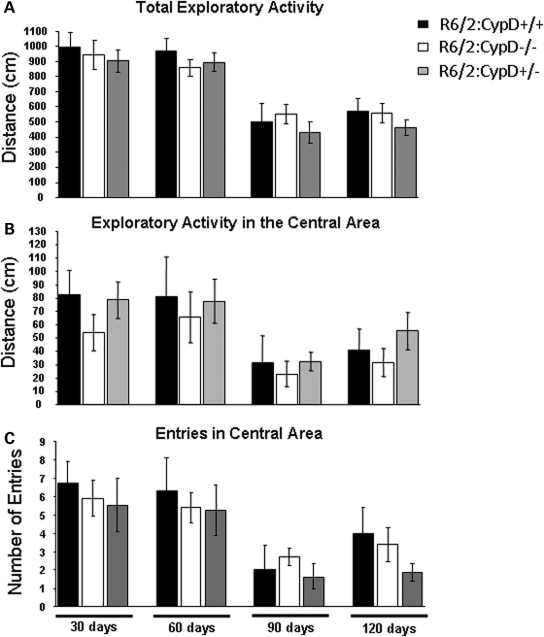
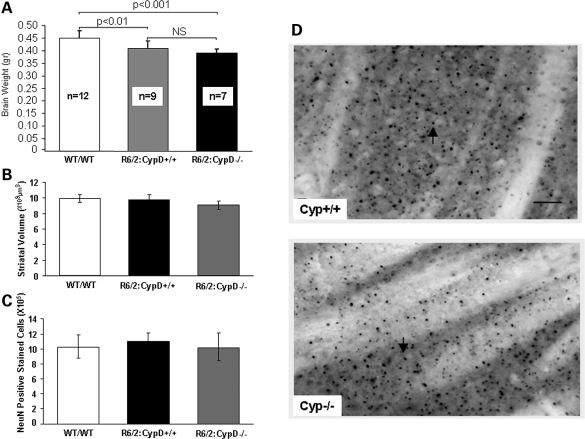
Huntington's disease (HD) is an incurable autosomal-dominant neurodegenerative disorder initiated by an abnormally expanded polyglutamine domain in the huntingtin protein. It is proposed that abnormal mitochondrial Ca2+ capacity results in an increased susceptibility to mitochondrial permeability transition (MPT) induction that may contribute significantly to HD pathogenesis. The in vivo contribution of these hypothesized defects remains to be elucidated. In this proof-of-principle study, we examined whether increasing mitochondrial Ca2+ capacity could ameliorate the well-characterized phenotype of the R6/2 transgenic mouse model. Mouse models lacking cyclophilin D demonstrate convincingly that cyclophilin D is an essential component and a key regulator of MPT induction. Mitochondria of cyclophilin D knockout mice are particularly resistant to Ca2+ overload. We generated R6/2 mice with normal, reduced or absent cyclophilin D expression and examined the effect of increasing mitochondrial Ca2+ capacity on the behavioral and neuropathological features of the R6/2 model. A predicted outcome of this approach was the finding that cyclophilin D deletion enhanced the R6/2 brain mitochondria Ca2+ capacity significantly. Increased neuronal mitochondrial Ca2+ capacity failed to ameliorate either the behavioral and neuropathological features of R6/2 mice. We found no alterations in body weight changes, lifespan, RotaRod performances, grip strength, overall activity and no significant effect on the neuropathological features of R6/2 mice. The results of this study demonstrate that increasing neuronal mitochondrial Ca2+-buffering capacity is not beneficial in the R6/2 mouse model of HD.


Figures

Figure 1.
Figure 1.
CAG repeat size, transgene levels and CypD expression. (A) CAG repeat sizes in the R6/2 transgene were measured in all mice included in the study and were not significantly different between R6/2 mice that are normal for CypD (R6/2:CypD+/+), knockout for CypD (R6/2:CypD−/−), and heterozygote for CypD (R6/2:CypD+/−) (F2,82 = 2661; P = 0.076). Data are presented as mean ± SD. (B) Expression levels of R6/2 mRNA in the cortex and cerebellum of R6/2:CypD+/+, R6/2:CypD−/− and R6/2:CypD+/− mice. No significant difference was detected between the different groups. Data are presented as mean ± SEM. (C) Representative immunoblots from a typical experiment demonstrating the absence of CypD (CypD) in cell homogenates from the striatum and hippocampus of R6/2:CypD−/− mice brain. CypD expression was reduced by ∼50% in striatal and hippocampal cell homogenates of R6/2:CypD+/− mice when compared with R6/2:CypD+/+ mice. The expression levels of the mitochondrial proteins ATP synthase (ATP Synt) and porin were similar between the different mouse lines. Tubulin immunoreactivity demonstrated that similar amount of proteins from different cell homogenates were loaded into the different lanes of the gel.
Figure 2.
Figure 2.
Effects of CypD on the mitochondria Ca2+ uptake and release of R6/2 mouse brains. (A) Kinetics of Ca2+ uptake and release of mitochondria isolated from the cortex of R6/2:CypD+/+ and R6/2:CypD−/− mice (153 days). Mitochondrial Ca2+-buffering capacities were monitored in a suspension of mitochondria (0.5 mg/ml) by examining the changes in calcium green-5N fluorescence upon addition of Ca2+ aliquots (10 nmol/aliquots in 2 µl). Increase in fluorescence reflects increases in extra mitochondrial Ca2+ whereas decrease in fluorescence reflects mitochondrial Ca2+ uptake. In mitochondria isolated from R6/2:CypD+/+ mice with subsequent additions of Ca2+ aliquots, there was a rapid decrease in the rate of Ca2+ uptake that was associated with an inability to return to the baseline level prior addition of the next Ca2+ aliquots. After a limited number of Ca2+ additions, brain mitochondria from R6/2:CypD+/+ did not uptake Ca2+ anymore and released their Ca2+ (sustained increased in fluorescence at the end of the traces). Whereas brain mitochondria from R6/2:CypD−/− mice were able to uptake Ca2+ more efficiently and to buffer a significantly higher amount of Ca2+ when compared with brain mitochondria from R6/2:CypD+/+. (B) Comparison of Ca2+ uptake and release of mitochondrial suspensions from R6/2:CypD+/+ and R6/2:CypD−/− mouse brains [enlargement and superposition of the first nine additions of Ca2+ aliquots (gray area in A)]. The kinetics of Ca2+ uptake was slower and extra mitochondrial Ca2+ did not return to basal level after addition of Ca2+ aliquots in R6/2:CypD+/+ brain mitochondria when compared with R6/2:CypD−/− brain mitochondria. (C) Immunoblot analysis of 10 µl of the mitochondrial suspensions with the mitochondrial proteins porin and ATP synthase revealed that a similar amount of the organelle was present in both mitochondrial preparations. As expected, CypD was not detected in the mitochondria suspension from R6/2:CypD−/− mice.
Figure 3.
Figure 3.
Effects of CypD on R6/2 mouse survival. (A) Survival curves for R6/2:CypD+/+, R6/2:CypD−/− and R6/2:CypD+/− mice. (B) Mean lifespan of R6/2:CypD+/+, R6/2:CypD−/− and R6/2:CypD+/− mice. Data are presented as mean ± SD. There was no significant effect of the CypD genotype on the mean lifespan of R6/2 mice (F2,55 = 2.863; P = 0.0656). (C) Lifespan of individual R6/2 mice in the different CypD genotype groups. Horizontal bars indicate the median lifespan in each genotype group.
Figure 4.
Figure 4.
Effects of CypD on the body weights of female and male R6/2 mice. Body weights of (A) female and (B) male R6/2:CypD+/+, R6/2:CypD−/− and R6/2:CypD+/− mice. Data are presented as mean ± SD. There was no significant effect of CypD genotype on the body weight of female and male R6/2 mice.
Figure 5.
Figure 5.
Effects of CypD on the motor performance of R6/2 mice. (A) Times before fall from rotarod at accelerating speeds (4–40 rpm) of R6/2:CypD+/+, (n = 16), R6/2:CypD−/− (n = 22) and R6/2:CypD+/− (n = 19) mice were monitored at 60, 90 and 120 days of age. Data are presented as mean ± SEM. (B) Motor performance of R6/2:CypD+/+ (n = 16), R6/2:CypD−/− (n = 20) and R6/2:CypD+/− (n = 19) mice using a constant speed rotarod protocol (10 rpm). At different time points examined, the CypD genotype Has no significant effect on both accelerated and fixed-speed rotarod performances of R6/2 mice. Data are presented as mean ± SEM.
Figure 6.
Figure 6.
Effects of CypD on the muscular strength of R6/2 mice. Forelimb (A) and combined (forelimb + hindlimb) (B) muscular strengths of R6/2:CypD+/+ (n = 15), R6/2:CypD−/− (n = 18) and R6/2:CypD+/− (n = 18) mice at 30, 60, 90 and 125 days of age. Data are presented as mean ± SEM.
Figure 7.
Figure 7.
Effects of CypD on the spontaneous locomotor activities and activity rhythms of R6/2 mice. Home cage activities at 90 days of age R6/2:CypD+/+, (n = 7), R6/2:CypD−/− (n = 11) and R6/2:CypD+/− (n = 13) were examined for 3 consecutive days. Results are presented as the average of (A) lower and (B) upper beams broken over a period of 24 h (light and dark), 12 h dark and 12 h light periods. (A) There was a significantly reduced horizontal activity of R6/2:CD+/− mice when compared with R6/2:CypD+/+ mice (F2,28 = 4.07, P = 0.028 and pairwise comparison R6/2:CD+/− versus R6/2:CypD+/+, P < 0.05). The reduced locomotor activity of R6/2:CD+/− mice was associated with a significantly reduced nocturnal activity (F2,28 = 4.89, P = 0.015 and pairwise comparison R6/2:CypD+/− versus R6/2:CypD+/+, P < 0.05). However, there was no significant difference in the spontaneous diurnal activity in the different genotype groups (F2,28 = 1.82, P = 0.181). For each groups, pairwise analysis revealed no significant difference between diurnal and nocturnal activities. (B) There was no significant effect of the CypD genotype on the rearing activity of all different genotype groups analyzed (F2,28 = 1.38, P = 0.267). There was no significant difference between the diurnal and nocturnal activity of the different R6/2 groups. All data are presented as mean ± SEM.
Figure 8.
Figure 8.
Effects of CypD on the exploratory activity and anxiety-like phenotype of R6/2 mice. Open-field activities of R6/2:CypD+/+ (n = 15), R6/2:CypD−/− (n = 18) and R6/2:CypD+/− (n = 18) mice. (A) Total exploratory activity of the mice in the entire arena, (B) exploratory activity and (C) number of entries of the mice into the central area of the open field. Data are presented as mean ± SEM. At all the different time points examined, there was no significant effect of the CypD genotype on the open-field activities of R6/2 mice.
Figure 9.
Figure 9.
Effects of CypD on the neuropathological phenotype of R6/2 mice. (A) Brain weights revealed a significant gross atrophy of brains from R6/2:CypD+/+ (0.41 ± 0.03 g) and R6/2:CypD−/− (0.39 ± 0.02 g) mice when compared with wild-type mouse brains (0.45 ± 0.03 g) (F2,25 = 11.87; P = 0.0002), with no significant effect of the CypD genotype on the brain weight of R6/2 mice (pairwise analysis R6/2:CypD+/+ versus R6/2:CypD−/−, P = 0.1469). Data are presented as mean ± SD. (BC) Unbiased stereology analysis in the striatum of 12–13 weeks of age wild type and R6/2 mice. Histograms showing (B) the total number of striatal NeuN-positive stained cells and (C) the striatal volume of wild-type (WT/WT), R6/2:CypD+/+ and R6/2:CypD−/− mice. Data are presented as the mean ± SEM for four animals in each genotype group. There was no significant difference in the number of NeuN-positive cells and striatal volumes between the genotype groups, and no significant effect of the CypD on any of these phenotypes in R6/2 mice (pairwise analysis R6/2:CypD+/+ versus R6/2:CypD−/−, P > 0.05). (D) Representative photomicrographs of huntingtin protein immunostaining within the striatum of R6/2:CypD+/+ and R6/2:CypD−/− mice. The CypD genotype did not affect the accumulation or the size of huntingtin-immunoreactive aggregates (arrows) in R6/2 mice. Scale bar equals 100 µm.

Similar articles

Cited by

References

    1. Folstein S.E. Huntington's Disease: a Disorder of Families. Baltimore: Johns Hopkins University Press; 1989.
    1. Hunter J.M., Crouse A.B., Lesort M., Johnson G.V., Detloff P.J. Verification of somatic CAG repeat expansion by pre-PCR fractionation. J. Neurosci. Methods. 2005;144:11–17. doi:10.1016/j.jneumeth.2004.10.006. - DOI - PubMed
    1. Trottier Y., Biancalana V., Mandel J.L. Instability of CAG repeats in Huntington's disease: relation to parental transmission and age of onset. J. Med. Genet. 1994;31:377–382. doi:10.1136/jmg.31.5.377. - DOI - PMC - PubMed
    1. Telenius H., Kremer B., Goldberg Y.P., Theilmann J., Andrew S.E., Zeisler J., Adam S., Greenberg C., Ives E.J., Clarke L.A., et al. Somatic and gonadal mosaicism of the Huntington disease gene CAG repeat in brain and sperm. Nat. Genet. 1994;6:409–414. doi:10.1038/ng0494-409. - DOI - PubMed
    1. Kennedy L., Evans E., Chen C.M., Craven L., Detloff P.J., Ennis M., Shelbourne P.F. Dramatic tissue-specific mutation length increases are an early molecular event in Huntington disease pathogenesis. Hum. Mol. Genet. 2003;12:3359–3367. doi:10.1093/hmg/ddg352. - DOI - PubMed

Publication types

MeSH terms