

Airway count and emphysema assessed by chest CT imaging predicts clinical outcome in smokers
- PMID: 20558554
- PMCID: PMC2951760
- DOI: 10.1378/chest.10-0542
Airway count and emphysema assessed by chest CT imaging predicts clinical outcome in smokers
Abstract
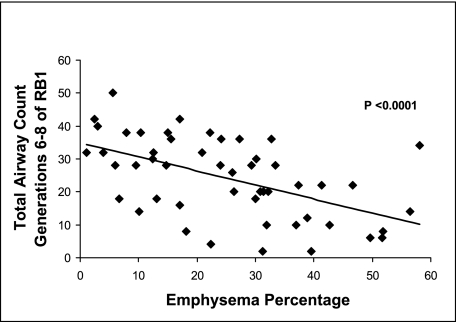
Background: Recently, it has been shown that emphysematous destruction of the lung is associated with a decrease in the total number of terminal bronchioles. It is unknown whether a similar decrease is visible in the more proximal airways. We aimed to assess the relationships between proximal airway count, CT imaging measures of emphysema, and clinical prognostic factors in smokers, and to determine whether airway count predicts the BMI, airflow obstruction, dyspnea, and exercise capacity (BODE) index.
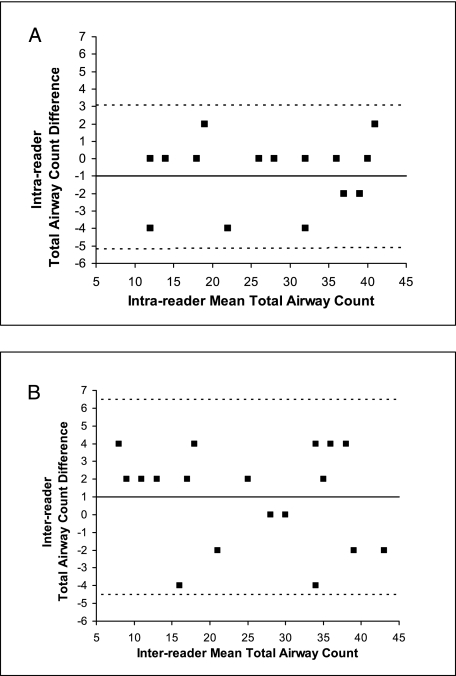
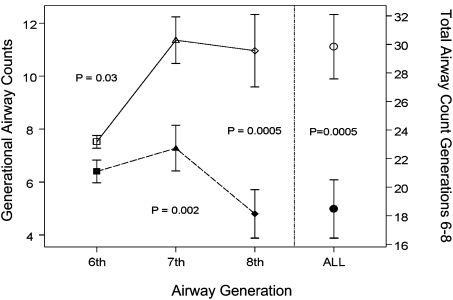
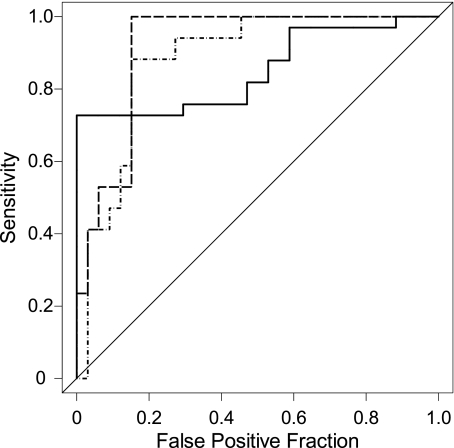
Methods: In 50 smokers, emphysema was measured on CT scans and airway branches from the third to eighth generations of the right upper lobe apical bronchus were counted manually. The sum of airway branches from the sixth to eighth generations represented the total airway count (TAC). For each subject, the BODE index was determined. We used logistic regression to assess the ability of TAC to predict a high BODE index (≥ 7 points).
Results: TAC was inversely associated with emphysema (r = -0.54, P < .0001). TAC correlated with the modified Medical Research Council dyspnea score (r = -0.42, P = .004), FEV(1)% predicted (r = 0.52, P = .0003), 6-min walk distance (r = 0.36, P = .012), and BODE index (r = -0.55, P < .0001). The C-statistics, which correspond to the area under the receiver operating characteristic curve, for the ability of TAC alone and TAC, emphysema, and age to predict a high BODE index were 0.84 and 0.92, respectively.
Conclusions: TAC is lower in subjects with greater emphysematous destruction and is a predictor of a high BODE index. These results suggest that CT imaging-based TAC may be a unique COPD-related phenotype in smokers.
Figures

References
-
- Hogg JC, Timens W. The pathology of chronic obstructive pulmonary disease. Annu Rev Pathol. 2009;4:435–459. - PubMed
-
- McLean KH. The histology of generalized pulmonary emphysema. II. Diffuse emphysema. Australas Ann Med. 1957;6(3):203–217. - PubMed
-
- McLean KH. The pathogenesis of pulmonary emphysema. Am J Med. 1958;25(1):62–74. - PubMed
Publication types
MeSH terms
Grants and funding
LinkOut - more resources
Full Text Sources
Other Literature Sources
Medical
