. 2010 Jul 23;329(5990):439-43.
doi: 10.1126/science.1191150. Epub 2010 Jun 17.

Integrative modeling defines the Nova splicing-regulatory network and its combinatorial controls

Affiliations

Integrative modeling defines the Nova splicing-regulatory network and its combinatorial controls

Chaolin Zhang et al. Science. .

Abstract

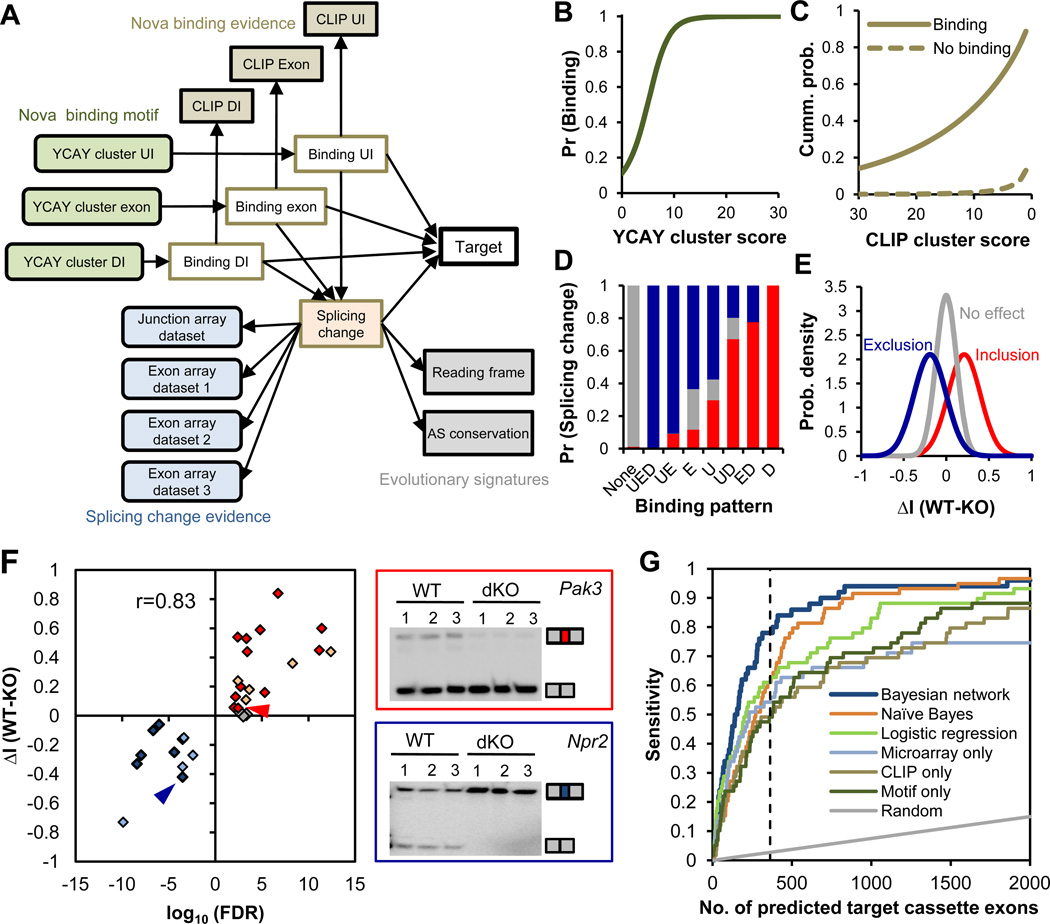
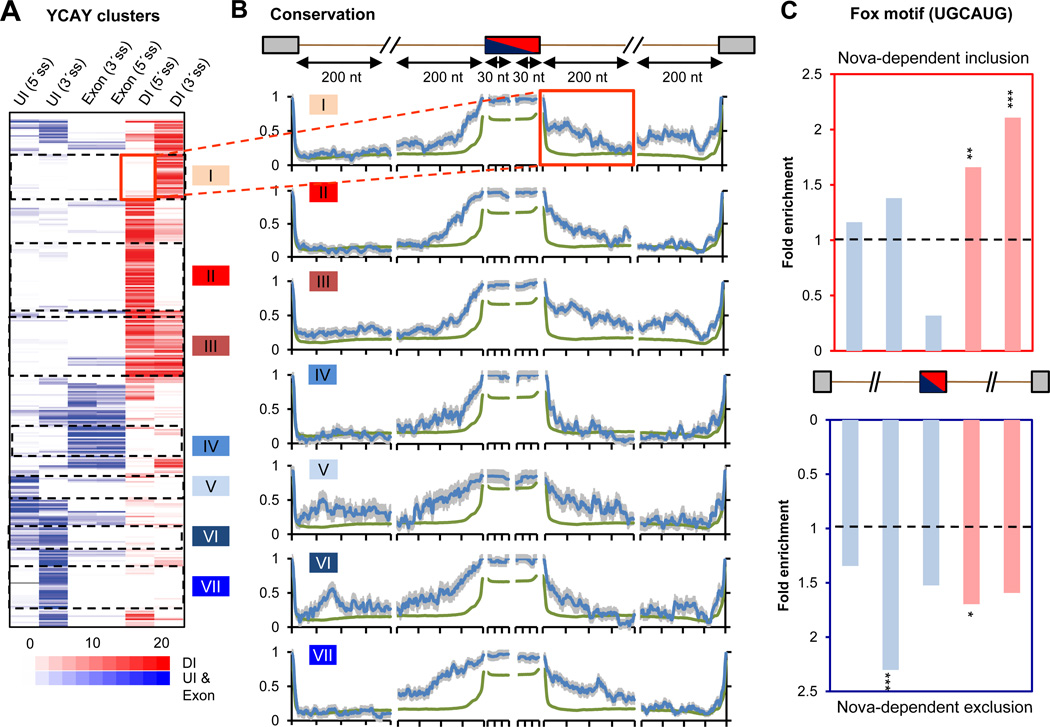
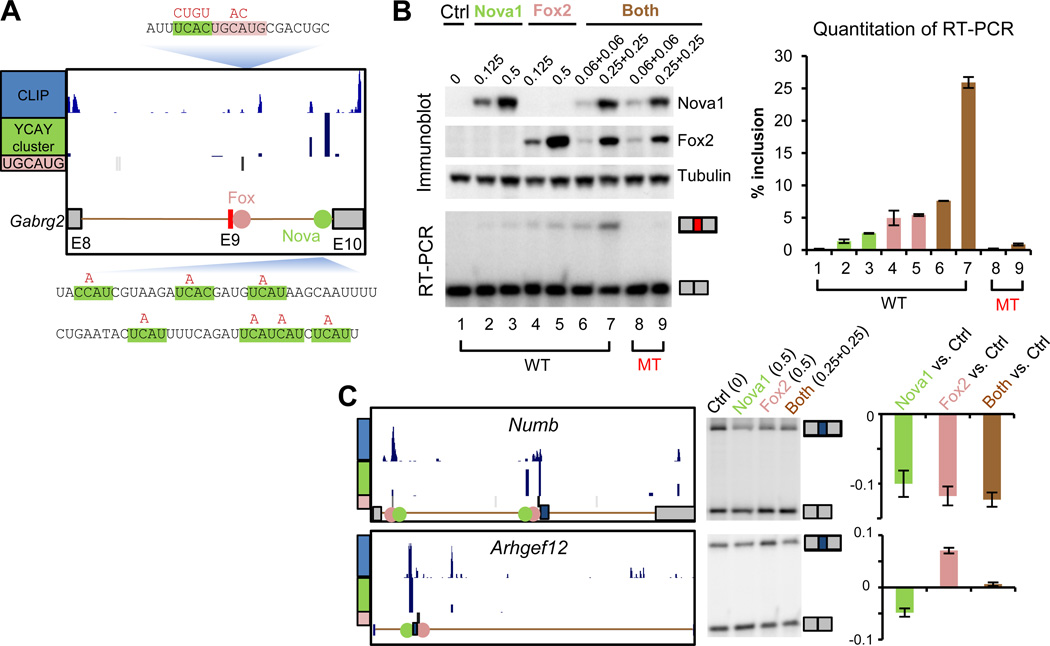
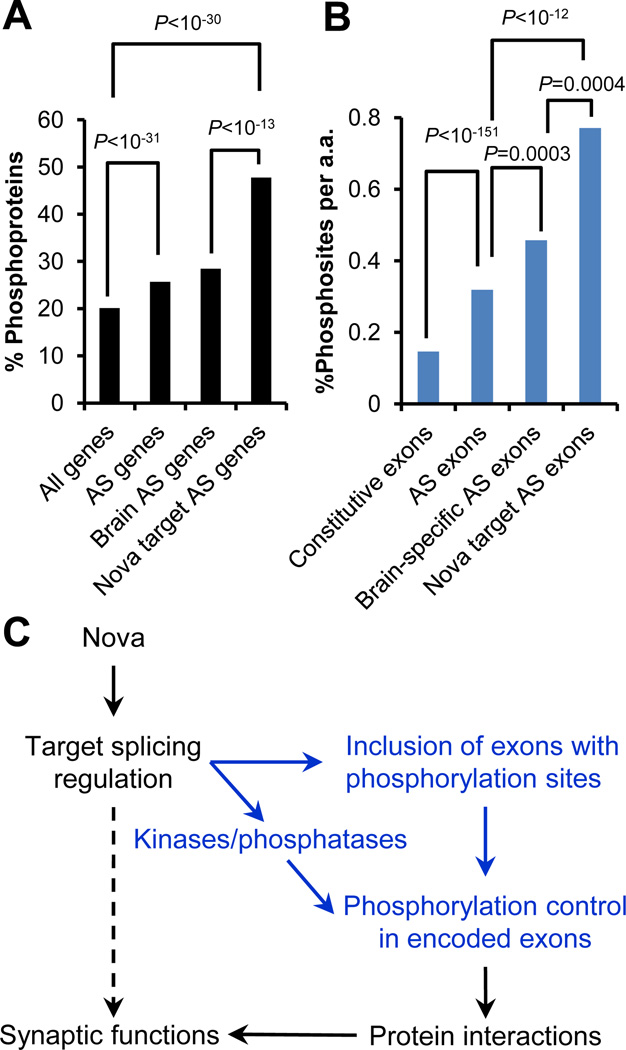
The control of RNA alternative splicing is critical for generating biological diversity. Despite emerging genome-wide technologies to study RNA complexity, reliable and comprehensive RNA-regulatory networks have not been defined. Here, we used Bayesian networks to probabilistically model diverse data sets and predict the target networks of specific regulators. We applied this strategy to identify approximately 700 alternative splicing events directly regulated by the neuron-specific factor Nova in the mouse brain, integrating RNA-binding data, splicing microarray data, Nova-binding motifs, and evolutionary signatures. The resulting integrative network revealed combinatorial regulation by Nova and the neuronal splicing factor Fox, interplay between phosphorylation and splicing, and potential links to neurologic disease. Thus, we have developed a general approach to understanding mammalian RNA regulation at the systems level.


Figures

Figure 1
Figure 1. Integrative prediction of Nova targets using a Bayesian network
The Bayesian network (BN) for cassette exons is shown. (A) Design of the BN. The 17 nodes (variables) model four types of data, including YCAY clusters and CLIP clusters in each cassette exon or flanking upstream (UI) and downstream introns (DI), splicing microarrays comparing WT and Nova KO brains, and evolutionary signatures. See table S3 for more details. (B–E) Estimated conditional probability distributions (CPDs) derived from the BN. (B) The probability of Nova binding to regions with varying YCAY cluster scores across all regions. (C) The cumulative probability of CLIP cluster scores across all regions with or without inferred Nova binding. (D) The probability of exons showing Nova-dependent inclusion (red), exclusion (blue), or no effect in comparisons of WT versus Nova KO brain transcripts, given the indicated combinatorial Nova binding patterns in exon (E), upstream (U) and downstream (D) introns. (E) The distribution of proportional splicing changes between WT and Nova KO brain RNA (ΔI, ref. (10)) measured by exon-junction arrays for exons with inferred Nova-dependent inclusion, exclusion or without Nova regulation. (F) A summary of RT-PCR analysis for the 31 exons tested in WT versus Nova KO brains. Twenty-two exons have Nova-regulated inclusion or exclusion (P<0.05; t-test), and those without significant changes tested in this study are shown in red, blue and gray, respectively; 9 previously validated exons are similarly shown in light red and light blue, respectively. The correlation between prediction confidence and the magnitude of splicing change is indicated. For two representative BN-predicted exons (arrow heads in the scatter plot), gel images are shown with the two isoforms including or excluding the regulated exon indicated (right panel). (G) Comparison of Nova target prediction by different methods (Bayesian network, naïve Bayes, and logistic regression) or using individual datasets (microarrays comparing E18.5 WT versus Nova1/2 double KO brains, CLIP clusters, and YCAY clusters). Each curve represents the prediction sensitivity with varying stringency; the performance of random predictions is also shown. The dotted line indicates the top 363 predictions.
Figure 2
Figure 2. Combinatorial regulation of Nova target exons
(A) Hierarchical clustering of 325 non-redundant Nova-regulated cassette exons using six regional YCAY cluster scores in exon, UI and DI relative to alternative splice sites. The position of DI and UI/exonic YCAY clusters is predicted to dictate Nova-regulated alternative exon inclusion (red) or exclusion (blue). Seven clusters of exons with distinct Nova-binding patterns are shown. (B) Sequence conservation scores across 20 mammalian species were extracted for 30 nt exonic regions near 5´ or 3´ splice site of the regulated exon, or for 200 nt intronic regions near all four possible splice sites, as indicated in the cartoon. The average conservation profile is shown for each cluster in (A) (blue), using all cassette exons as a control (green). Error bars represent standard errors. The flanking intronic region downstream of the cassette exon in cluster I is highlighted. (C) The enrichment of the Fox motif (UGCAUG) in exons with Nova-regulated inclusion (top) or exclusion (bottom), as compared to control cassette exons. Fox-binding sites predicted to dictate Fox-regulated exon inclusion (DI) or exclusion (UI/exon) are represented by red and blue bars, respectively. Statistical significance is derived from a χ2 test (*: P<0.05; **: P<0.01; ***: P<0.001).
Figure 3
Figure 3. Experimental validation of Nova and Fox combinatorial regulation
(A) Schematic representation of exon 8 (E8) to exon 10 (E10) of the Gabrg2 minigene (26). The CLIP tags, YCAY clusters and UGCAUG elements are shown above the cartoon. Sequences flanking Nova (shaded in green) and Fox (shaded in red) binding sites are shown. Mutations used to disrupt the Nova and Fox binding sites are indicated above the sequence. (B) After transfection of 293T cells with the Gabrg2 minigene in the presence of the indicated amounts (in ug) of Control (Ctrl), Nova1, or Fox2 expression plasmids, cells were analyzed for the indicated proteins by immunoblot and for Gabrg2 E9 splicing by RT-PCR with primers flanking E9. RT-PCR yielded the larger E9 included and smaller E9 excluded isoforms, as indicated (middle panel), and the inclusion level was quantitated in the bar graph (right panel); error bars represent standard errors estimated from two biological replicates. (C) Two additional examples of exons under Nova1 and Fox2 combinatorial regulation. For each panel, the AS region, CLIP tags, YCAY clusters and UGCAUAG elements are shown as in (A). The RT-PCR analysis is shown in the middle, with alternative isoforms indicated. The four lanes represent control cells, and cells transfected with Nova1 (0.5 µg), Fox2 (0.5 µg) and both proteins (0.25 µg +0.25 µg), respectively. The quantitated splicing changes (ΔI), are shown on the right, with averages and standard errors estimated from four replicates.
Figure 4
Figure 4. Nova target AS switches protein phosphorylation
(A) Percentage of phosphoproteins for different sets of genes. (B) Percentage of experimentally determined phosphorylation sites per amino acid for different sets of exons. Different groups in (A) and (B) were compared by a Fisher’s exact test, respectively. (C) A model of Nova AS regulation to control protein phosphorylation patterns, a mechanism to modulate downstream protein-protein interactions and synaptic functions.

References

    1. Nilsen TW, Graveley BR. Expansion of the eukaryotic proteome by alternative splicing. Nature. 2010;463:457. - PMC - PubMed
    1. Licatalosi DD, Darnell RB. RNA processing and its regulation: global insights into biological networks. Nat Rev Genet. 2010;11:75. - PMC - PubMed
    1. Cooper TA, Wan L, Dreyfuss G. RNA and disease. Cell. 2009;136:777. - PMC - PubMed
    1. Li Q, Lee J-A, Black DL. Neuronal regulation of alternative pre-mRNA splicing. Nat Rev Neurosci. 2007;8:819. - PubMed
    1. Licatalosi DD, Darnell RB. Splicing regulation in neurologic disease. Neuron. 2006;52:93. - PubMed

Publication types

MeSH terms

Associated data