. 2010 Oct 8;285(41):31217-32.
doi: 10.1074/jbc.M110.149161. Epub 2010 Jun 17.

Selective translational control of the Alzheimer amyloid precursor protein transcript by iron regulatory protein-1

Affiliations

Selective translational control of the Alzheimer amyloid precursor protein transcript by iron regulatory protein-1

Hyun-Hee Cho et al. J Biol Chem. .

Abstract

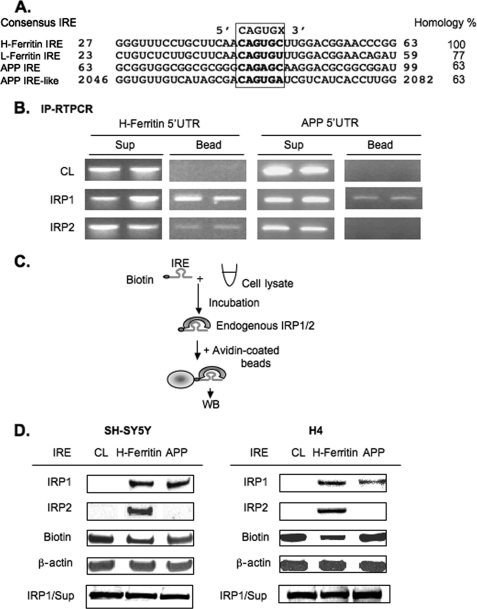
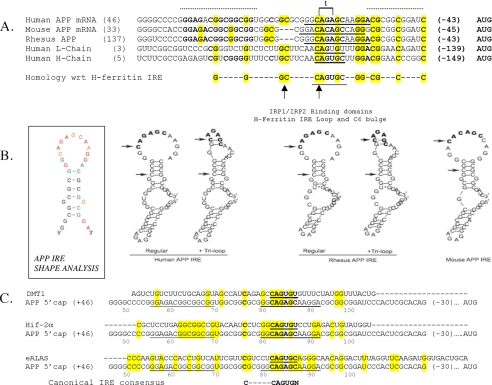
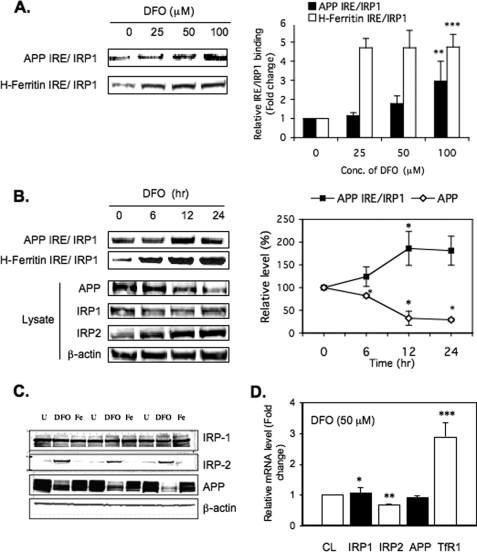
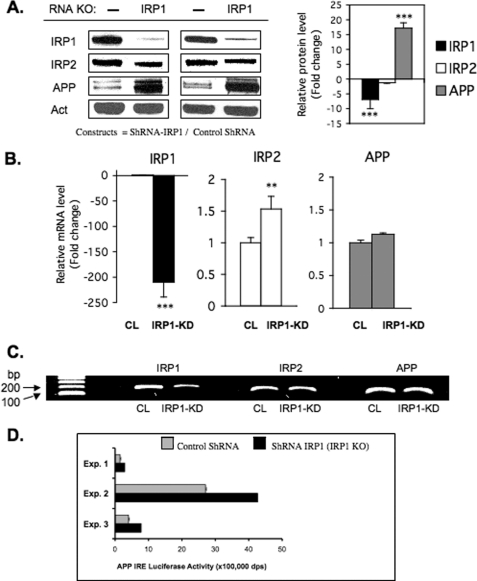
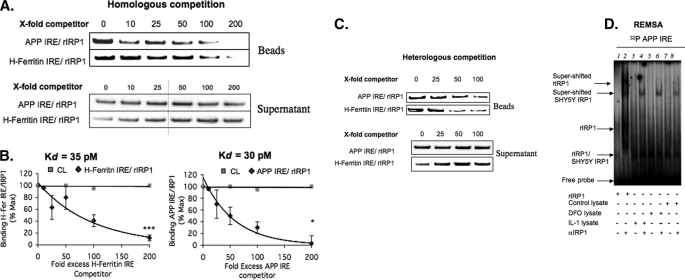
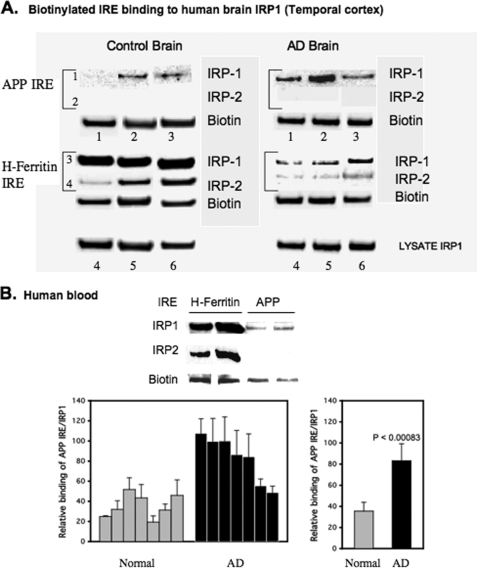
Iron influx increases the translation of the Alzheimer amyloid precursor protein (APP) via an iron-responsive element (IRE) RNA stem loop in its 5'-untranslated region. Equal modulated interaction of the iron regulatory proteins (IRP1 and IRP2) with canonical IREs controls iron-dependent translation of the ferritin subunits. However, our immunoprecipitation RT-PCR and RNA binding experiments demonstrated that IRP1, but not IRP2, selectively bound the APP IRE in human neural cells. This selective IRP1 interaction pattern was evident in human brain and blood tissue from normal and Alzheimer disease patients. We computer-predicted an optimal novel RNA stem loop structure for the human, rhesus monkey, and mouse APP IREs with reference to the canonical ferritin IREs but also the IREs encoded by erythroid heme biosynthetic aminolevulinate synthase and Hif-2α mRNAs, which preferentially bind IRP1. Selective 2'-hydroxyl acylation analyzed by primer extension analysis was consistent with a 13-base single-stranded terminal loop and a conserved GC-rich stem. Biotinylated RNA probes deleted of the conserved CAGA motif in the terminal loop did not bind to IRP1 relative to wild type probes and could no longer base pair to form a predicted AGA triloop. An AGU pseudo-triloop is key for IRP1 binding to the canonical ferritin IREs. RNA probes encoding the APP IRE stem loop exhibited the same high affinity binding to rhIRP1 as occurs for the H-ferritin IRE (35 pm). Intracellular iron chelation increased binding of IRP1 to the APP IRE, decreasing intracellular APP expression in SH-SY5Y cells. Functionally, shRNA knockdown of IRP1 caused increased expression of neural APP consistent with IRP1-APP IRE-driven translation.


Figures

FIGURE 1.
FIGURE 1.
The iron-responsive element in the 5′-UTR of APP mRNA binds to IRP1, but not IRP2, in both SH-SY5Y and H4 neural cell lines. A, alignment of nucleotide sequence from H-ferritin, L-ferritin, and APP IREs showing homology to the H-ferritin IRE sequence. B, representative IP-RT-PCR experiment (n = 4) showing that APP mRNA binds IRP1, but not IRP2, whereas the H-ferritin mRNA binds both IRP1 and IRP2. SH-SY5Y cell lysates (500 μg) were incubated with 3 μg of either IRP1 or IRP2 antibody and 30 μl of A/G PLUS agarose bead slurry. Rabbit IgG, precleared with beads, was used as a negative control. Following IP, RT-PCR was performed from RNAs extracted from both beads and supernatant (Sup) where specific H-ferritin and APP primers were used to detect the presence/absence of each transcript. Data from duplicate samples are presented. C, a diagrammatic representation of the technique for the biotin pulldown assay. Briefly, biotin-labeled IRE probe was incubated with cell lysate (CL), and the binding protein-IRE complex was precipitated with streptavidin-coated beads followed by Western blotting (WB) of the attached proteins. D, SH-SY5Y (n = 8) and H4 (n = 3) lysates were incubated with 37-base-long biotinylated RNA probes encoding either H-ferritin or APP IRE sequences as shown. IRP1/2 IRE complexes were detected by WB using anti-IRP1/2 antibodies. Total lysate for each sample was probed for β-actin to ensure correctly balanced loading. IRP1 levels in the supernatants were unchanged across all pulldowns (bottom row).
FIGURE 2.
FIGURE 2.
Sequence and RNA structural specificity of IRP1 binding to the IRE motif in the 5′-untranslated region of the APP transcript. Panel A, primary sequence homology among the human, rhesus monkey, and mouse APP IREs where 100% conservation among the three species is demarked by a dotted line above the alignment. Sequences encoding the canonical IRE RNA stem loops in the 5′-untranslated region of ferritin L- and H-chain are aligned to the APP IRE such that CAGUGC terminal loop of the H-ferritin IRE is bold and underlined. The arrows indicate the C-6 bulge and the start of the apical CAGUGN loop in the ferritin IRE. The homologous CAGAGC motif of the APP IRE (panel B) is bold and underlined as six nucleotides in the 13-base terminal loop predicted for the APP IRE (panel B below). The super-conserved homology among all three APP IREs and both L-ferritin and H-ferritin subunits is shown both in bold and highlighted lettering, whereas the evolutionary conservation is demarked only by bold lettering. The sequences matching the known L- and H-ferritin pseudo-triloops are indicated in brackets and by letter t. Panel B, left, RNA secondary structure of the APP IRE was assessed by the SHAPE technique (93). This measured the likelihood of whether any given nucleotide is base-paired to participate in a double-stranded RNA helix or is encoded by single-stranded RNA, where it is exposed to chemical modification (147 bases input APP 5′-UTR RNA). The normalized SHAPE reactivity was incorporated into the RNAstructure 4.6 software, which uses both nearest neighbor free energy parameters and SHAPE data as pseudo-energy parameters to develop a secondary structure prediction. Nucleotides are colored black (unreactive, SHAPE reactivity < 0.2), green (0.2 ≤ SHAPE reactivity < 0.4), orange (0.4 ≤ SHAPE reactivity < 0.6), and red (highly reactive, SHAPE reactivity ≥ 0.6), or gray (no data due to RNA degradation) (description of potential base-pairing within the terminal loop is provided in supplemental Fig. 1. Right, human, rhesus monkey, and mouse APP IRE secondary structures were predicted by the RNAshapes program. The human and rhesus monkey APP IREs were predicted to be capable of forming alternative RNA stem loops, either with no internal base pairing to generate a 13-base terminal loop or alternatively with two hydrogen bonds internal to the terminal loop that may generate an AGA triloop. The mouse APP IRE sequences do not permit this alternative base pairing within the terminal loop. Input nucleotide sequences were chosen to include the evolutionary hyper-conserved motifs (panel A, dotted line) including sequences from 35 and 16 bases on each side of the human APP-specific CAGAGC loop and 33 and 16 bases on each side of the rhesus monkey and mouse CAGAGC IRE loops (panel A). The arrows refer to the beginning position of the CAGAGC motif in the APP IRE, and the second arrow refers to the upstream cytosine (C-6). Panel C, pairwise homology between the APP IRE with corresponding sequences in the DMT-1 IRE, the Hif-2α IRE, and the eALAS IRE. The APP IRE exhibits 38% homology with the IREs of the transcripts for eALAS, Hif-2α, and L-ferritin with a lower 25% homology to the DMT-1 IRE (50% homology with the ferritin H-chain IRE over a 48-base region). A conserved C nucleotide is present +76 bases from the APP mRNA 5′ cap site; this C is similarly placed upstream of the APP terminal loop-specific CAGAGC motif as the conserved C-bulge that is 6 bases upstream of the H-ferritin CAGUGN terminal loop. Panel D, relative position of the functional APP IRE sequence (1) and the second APP IRE-like motif in of the Aβ region in the coding region of linear APP-695 mRNA (+1906 to +1931 with respect to APP-695). The specificity of interactions between IRP1 and biotinylated APP IRE probes relative to matched 37-base APP IRE-like probes was monitored by the pulldown assay as shown in Fig. 1D (n = 3). Row 1, Western blot detection of IRP1 that selectively bound to biotinylated APP IRE beads but not tRNA or biotinylated APP IRE-like beads (in triplicate). Row 2, biotin levels were monitored as loading controls to ensure equal bead recovery between lanes. Rows 3 and 4, Western blot confirmation that unchanged levels of IRP1 and β-actin were present in the lysate supernatants committed to the pulldown assay. CL, cell lysate. Panel E, RNA binding assays with the short and long biotinylated RNA probes encoding the wild type APP IRE when compared with the CAGA deletion. Lanes 1 and 2, 37-base wild type APP IRE (short form); Lanes 3 and 4, 57-base wild type APP IRE (long form); lanes 5 and 6, CAGA mutant version APP IRE (33 bases). IRP pulldown was registered by Western blots as described under “Experimental Procedures.” Panel F, the predicted secondary structures of the 37-nt RNA sequences encoding: 1 and 2, the canonical L-ferritin IRE (without and with the known AGU pseudo-triloop); 3 and 4, the APP IRE without and with the predicted AGA triloop in the GGCAGAGCAAGGA terminal loop; 5, the APP IRE ΔCAGA; 6, the APP Aβ region IRE-like domain. Predictions were by the RNAshapes program using the 37-base input sequences (shown as a positive control; the L-ferritin IRE CAGUGU terminal loop is 9 bases downstream from the 5′ end and 10 bases from the 3′ end).
FIGURE 2.
FIGURE 2.
Sequence and RNA structural specificity of IRP1 binding to the IRE motif in the 5′-untranslated region of the APP transcript. Panel A, primary sequence homology among the human, rhesus monkey, and mouse APP IREs where 100% conservation among the three species is demarked by a dotted line above the alignment. Sequences encoding the canonical IRE RNA stem loops in the 5′-untranslated region of ferritin L- and H-chain are aligned to the APP IRE such that CAGUGC terminal loop of the H-ferritin IRE is bold and underlined. The arrows indicate the C-6 bulge and the start of the apical CAGUGN loop in the ferritin IRE. The homologous CAGAGC motif of the APP IRE (panel B) is bold and underlined as six nucleotides in the 13-base terminal loop predicted for the APP IRE (panel B below). The super-conserved homology among all three APP IREs and both L-ferritin and H-ferritin subunits is shown both in bold and highlighted lettering, whereas the evolutionary conservation is demarked only by bold lettering. The sequences matching the known L- and H-ferritin pseudo-triloops are indicated in brackets and by letter t. Panel B, left, RNA secondary structure of the APP IRE was assessed by the SHAPE technique (93). This measured the likelihood of whether any given nucleotide is base-paired to participate in a double-stranded RNA helix or is encoded by single-stranded RNA, where it is exposed to chemical modification (147 bases input APP 5′-UTR RNA). The normalized SHAPE reactivity was incorporated into the RNAstructure 4.6 software, which uses both nearest neighbor free energy parameters and SHAPE data as pseudo-energy parameters to develop a secondary structure prediction. Nucleotides are colored black (unreactive, SHAPE reactivity < 0.2), green (0.2 ≤ SHAPE reactivity < 0.4), orange (0.4 ≤ SHAPE reactivity < 0.6), and red (highly reactive, SHAPE reactivity ≥ 0.6), or gray (no data due to RNA degradation) (description of potential base-pairing within the terminal loop is provided in supplemental Fig. 1. Right, human, rhesus monkey, and mouse APP IRE secondary structures were predicted by the RNAshapes program. The human and rhesus monkey APP IREs were predicted to be capable of forming alternative RNA stem loops, either with no internal base pairing to generate a 13-base terminal loop or alternatively with two hydrogen bonds internal to the terminal loop that may generate an AGA triloop. The mouse APP IRE sequences do not permit this alternative base pairing within the terminal loop. Input nucleotide sequences were chosen to include the evolutionary hyper-conserved motifs (panel A, dotted line) including sequences from 35 and 16 bases on each side of the human APP-specific CAGAGC loop and 33 and 16 bases on each side of the rhesus monkey and mouse CAGAGC IRE loops (panel A). The arrows refer to the beginning position of the CAGAGC motif in the APP IRE, and the second arrow refers to the upstream cytosine (C-6). Panel C, pairwise homology between the APP IRE with corresponding sequences in the DMT-1 IRE, the Hif-2α IRE, and the eALAS IRE. The APP IRE exhibits 38% homology with the IREs of the transcripts for eALAS, Hif-2α, and L-ferritin with a lower 25% homology to the DMT-1 IRE (50% homology with the ferritin H-chain IRE over a 48-base region). A conserved C nucleotide is present +76 bases from the APP mRNA 5′ cap site; this C is similarly placed upstream of the APP terminal loop-specific CAGAGC motif as the conserved C-bulge that is 6 bases upstream of the H-ferritin CAGUGN terminal loop. Panel D, relative position of the functional APP IRE sequence (1) and the second APP IRE-like motif in of the Aβ region in the coding region of linear APP-695 mRNA (+1906 to +1931 with respect to APP-695). The specificity of interactions between IRP1 and biotinylated APP IRE probes relative to matched 37-base APP IRE-like probes was monitored by the pulldown assay as shown in Fig. 1D (n = 3). Row 1, Western blot detection of IRP1 that selectively bound to biotinylated APP IRE beads but not tRNA or biotinylated APP IRE-like beads (in triplicate). Row 2, biotin levels were monitored as loading controls to ensure equal bead recovery between lanes. Rows 3 and 4, Western blot confirmation that unchanged levels of IRP1 and β-actin were present in the lysate supernatants committed to the pulldown assay. CL, cell lysate. Panel E, RNA binding assays with the short and long biotinylated RNA probes encoding the wild type APP IRE when compared with the CAGA deletion. Lanes 1 and 2, 37-base wild type APP IRE (short form); Lanes 3 and 4, 57-base wild type APP IRE (long form); lanes 5 and 6, CAGA mutant version APP IRE (33 bases). IRP pulldown was registered by Western blots as described under “Experimental Procedures.” Panel F, the predicted secondary structures of the 37-nt RNA sequences encoding: 1 and 2, the canonical L-ferritin IRE (without and with the known AGU pseudo-triloop); 3 and 4, the APP IRE without and with the predicted AGA triloop in the GGCAGAGCAAGGA terminal loop; 5, the APP IRE ΔCAGA; 6, the APP Aβ region IRE-like domain. Predictions were by the RNAshapes program using the 37-base input sequences (shown as a positive control; the L-ferritin IRE CAGUGU terminal loop is 9 bases downstream from the 5′ end and 10 bases from the 3′ end).
FIGURE 3.
FIGURE 3.
Increased IRP1 binding to APP IRE probes in response to dose- and time-dependent treatment of SH-SY5Y cells with the intracellular iron chelator, DFO. A, DFO dose response (n = 3). SH-SY5Y cells were treated with 0, 25, 50, or 100 μm DFO for 12 h followed by biotin pulldown assay of the IRP1-APP IRE and IRP1-H-ferrritin IRE interactions. Bead samples were Western blotted to detect the levels of bound IRP1. Quantitation of Western blots was performed using Quantity One software (Bio-Rad). The values plotted are means ± S.D. of n = 3 independent experiments for each time point. Conc., concentration. B, DFO time course (n = 3). Left panel, SH-SY5Y cells were treated with 50 μm DFO for 0, 6, 12, or 24 h followed by WB of IRP1 bound to either biotinylated APP-IRE or biotinylated H-ferritin IRE probes (top two rows) and WB of 5 μg of total lysate to measure APP, IRP1, IRP2, and β-actin levels. Right panel, densitometry and graphic measurement of the time course of DFO-induced binding of SH-SY5Y IRP1 to APP IRE probe correlated directly with total levels of APP in the same lysates. The values plotted are means ± S.D. of n = 3 independent experiments for each time point. C, second representative WB of an experiment showing DFO-dependent reduction of APP expression in SH-SY5Y cells (50 μm DFO (48 h) where β-actin and IRP1 levels were unchanged (IPR2 protein stabilization in response to DFO; experimental positive control)). D, real-time qPCR analysis and measurement of DFO-regulated gene expression (n = 3). SH-SY5Y cells were treated with 50 μm DFO for 12 h and then harvested for quantitative RT-PCR assays. The expression and steady-state mRNA levels of IRP1, IRP2, APP, and TfR1 genes were averaged relative to untreated control condition and corrected for the expression of the β-actin gene. TfR1 mRNA expression was used as a positive control because TfR levels are already known to be up-regulated by DFO via IRE-dependent stabilization of the receptor transcript. CL, cell lysate; U, untreated.
FIGURE 4.
FIGURE 4.
Stable knockdown of IRP1 increases the expression of APP in shRNA transfected H4 neural cells. A, total protein extracts were prepared from SH-SY5Y cells stably expressing shRNAs against human IRP1. A non-targeting siRNA sequence was transfected as a control. IRP1 and APP protein levels were determined by Western blot in control cells and IRP1 knockdown cells, and β-actin (Act) was used as a control (n = 4). The relative change of IRP1, IRP2, and APP protein levels was quantitated in two of the clones (left panel) and presented as -fold change (histogram; right panel). B, real-time qPCR (n = 6) was carried out on the ABI Prism 7000 sequence detection system (Applied Biosystems). Total RNA was isolated using TRIzol reagent (Sigma) according to the manufacturer's instructions. cDNA was synthesized with SuperScript III first-strand qPCR supermix (Invitrogen) according to the manufacturer's instructions. The primers (IRP1, IRP2, β-actin, TfR1) were designed as in Ref. and ordered from Invitrogen. The APP primer set was purchased from Qiagen and has been benchmarked on several reports for accurate measurement of APP mRNA levels (62). CL, cell lysate. KD, knockdown. C, representative 2% agarose gel employed during qRT-PCR and analysis to generate the data shown in panel B. D, three separate reporter assays (Exp. 1–3) registering APP 5′-UTR-luciferase activity in IRP1 shRNA knockdown cells relative to normal IRP1 expression (empty shRNA control).
FIGURE 5.
FIGURE 5.
rhIRP1 binds to APP IRE and H-ferritin IRE probes with similar binding affinity in vitro. Competition assays were employed (n = 4) with rhIRP1 and the use of incrementally increasing concentrations of APP IRE and H-ferritin-IRE RNAs in the presence of biotinylated RNA probes (“Experimental Procedures”). A, homologous competition (n = 3). rhIRP1 was incubated with either 25 nm biotinylated APP IRE or H-ferritin IRE in the presence of a 0-, 10-, 25-, 50-, 100-, or 200-fold (25, 250, 625, 1250, 2500, or 5000 nm) excess of unlabeled APP IREs or H-ferritin IRE. B, Scatchard plots from the quantitated data of panel A were used to calculate the dissociation constants (Kd) of rhIRP1 binding to H-ferritin IRE (left side) or APP IRE (right side). C, heterologous competition (n = 3). 25 nm biotinylated APP IRE was competed with 0-, 25-, 50-, or 100-fold unlabeled H-ferritin IRE, and likewise, 25 nm biotinylated H-ferritin IRE was competed with 0-, 25-, 50-, or 100-fold unlabeled APP IRE. D, RNA gel-shift analysis was performed with the 37-nt radiolabeled RNA probe encoding APP IRE (37 nt) sequences as used in the biotin pulldown assays (previously reported by Rogers et al. (1)), including a supershift assay demonstrating that the APP IRE probes employed for biotin pulldown assays detected rhIRP1- and SH-SY5Y-specific IRP1 binding with the same specificity. Lane 1, rhIRP1; lane 2, rhIRP + IRP-specific antibody; lane 3 SH-SY5Y/DFO, 100 μm; lane 4, SH-SY5Y/DFO 100 μm + IRP Ab; lane 5, SH-SY5Y/IL 1β; lane 6, SH-SY5Y/IL-1β + IRP Ab; lane 7 SH-SY5Y/Control; Lane 8, SH-SY5YControl + IRP1 Ab.
FIGURE 6.
FIGURE 6.
IRP1, but not IRP2, in human brain and blood tissue binds specifically to 5′-UTR-specific APP IRE sequences. A, biotin pulldown assay showing specificity of human brain IRP1-IRP2 binding to probes for the APP IRE relative to the H-ferritin IRE using lysates from postmortem temporal cortex from three AD subjects and three normal (age-matched) subjects. Lanes 1–6, pulldowns with biotinylated APP IRE (lanes 1–3) and H-ferritin IRE (lanes 4–6) RNA probes. Rows 1 and 2 are pulldowns with the 37-base biotinylated APP IRE probe. Rows 3 and 4 are pulldowns with the 37-base H-ferritin IRE, in each case visualized by Western blotting with IRP1 Ab (rows 1 and 3) or IRP2 Ab (rows 2 and 4). The presence of biotin was checked by Western blotting each bead sample to ensure equal efficiency of RNA probe recovery (IRE input). To ensure balanced loadings, the supernatants of lysates used in each pulldown were probed to determine unchanged levels of IRP1. B, human blood tissue samples were subjected to biotin pulldown assay using APP IREs, and associated IRP1 proteins were analyzed by WB. Data from duplicate samples were presented in the histogram shown. The values plotted are means ± S.E. of APP IRE-IRP1 binding from each of seven blood samples from age-matched controls (Normal) and AD patients.

Similar articles

Cited by

References

    1. Rogers J. T., Randall J. D., Cahill C. M., Eder P. S., Huang X., Gunshin H., Leiter L., McPhee J., Sarang S. S., Utsuki T., Greig N. H., Lahiri D. K., Tanzi R. E., Bush A. I., Giordano T., Gullans S. R. (2002) J. Biol. Chem. 277, 45518–45528 - PubMed
    1. Wolfe M. S. (2006) Sci. Am. 294, 72–79 - PubMed
    1. Walsh D. M., Klyubin I., Fadeeva J. V., Cullen W. K., Anwyl R., Wolfe M. S., Rowan M. J., Selkoe D. J. (2002) Nature 416, 535–539 - PubMed
    1. Lee V. M., Giasson B. I., Trojanowski J. Q. (2004) Trends Neurosci. 27, 129–134 - PubMed
    1. Wolfe M. S., Xia W., Ostaszewski B. L., Diehl T. S., Kimberly W. T., Selkoe D. J. (1999) Nature 398, 513–517 - PubMed

Publication types

MeSH terms