

Lamellar bodies form solid three-dimensional films at the respiratory air-liquid interface
- PMID: 20558742
- PMCID: PMC2934682
- DOI: 10.1074/jbc.M110.106518
Lamellar bodies form solid three-dimensional films at the respiratory air-liquid interface
Abstract
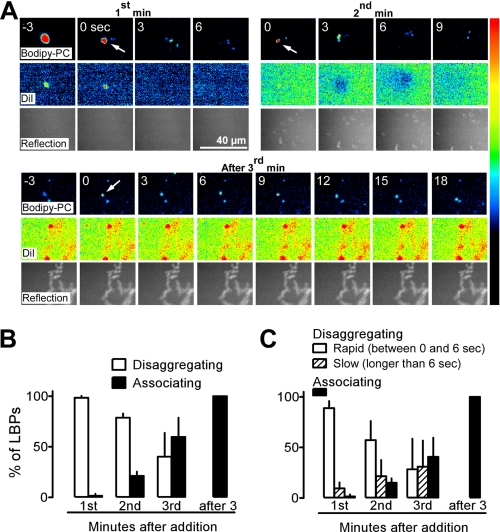
Pulmonary surfactant is essential for lung function. It is assembled, stored and secreted as particulate entities (lamellar body-like particles; LBPs). LBPs disintegrate when they contact an air-liquid interface, leading to an instantaneous spreading of material and a decline in surface tension. Here, we demonstrate that the film formed by the adsorbed material spontaneously segregate into distinct ordered and disordered lipid phase regions under unprecedented near-physiological conditions and, unlike natural surfactant purified from bronchoalveolar lavages, dynamically reorganized into highly viscous multilayer domains with complex three-dimensional topographies. Multilayer domains, in coexistence with liquid phases, showed a progressive stiffening and finally solidification, probably driven by a self-driven disassembly of LBPs from a sub-surface compartment. We conclude that surface film formation from LBPs is a highly dynamic and complex process, leading to a more elaborated scenario than that observed and predicted by models using reconstituted, lavaged, or fractionated preparations.
Figures


Similar articles
-
Pneumocytes Assemble Lung Surfactant as Highly Packed/Dehydrated States with Optimal Surface Activity.Biophys J. 2015 Dec 1;109(11):2295-306. doi: 10.1016/j.bpj.2015.10.022. Biophys J. 2015. PMID: 26636941 Free PMC article.
-
Physiological variables affecting surface film formation by native lamellar body-like pulmonary surfactant particles.Biochim Biophys Acta. 2014 Jul;1838(7):1842-50. doi: 10.1016/j.bbamem.2014.02.015. Epub 2014 Feb 27. Biochim Biophys Acta. 2014. PMID: 24582711
-
A small key unlocks a heavy door: The essential function of the small hydrophobic proteins SP-B and SP-C to trigger adsorption of pulmonary surfactant lamellar bodies.Biochim Biophys Acta. 2016 Aug;1863(8):2124-34. doi: 10.1016/j.bbamcr.2016.04.028. Epub 2016 May 4. Biochim Biophys Acta. 2016. PMID: 27155084
-
Role of lipid ordered/disordered phase coexistence in pulmonary surfactant function.Biochim Biophys Acta. 2012 Nov;1818(11):2550-62. doi: 10.1016/j.bbamem.2012.05.024. Epub 2012 May 31. Biochim Biophys Acta. 2012. PMID: 22659676 Review.
-
Phospholipid metabolism in lung surfactant.Subcell Biochem. 2004;37:359-88. doi: 10.1007/978-1-4757-5806-1_11. Subcell Biochem. 2004. PMID: 15376627 Review.
Cited by
-
Novel opportunities from bioimaging to understand the trafficking and maturation of intracellular pulmonary surfactant and its role in lung diseases.Front Immunol. 2023 Aug 10;14:1250350. doi: 10.3389/fimmu.2023.1250350. eCollection 2023. Front Immunol. 2023. PMID: 37638003 Free PMC article. Review.
-
The pristine unused pulmonary surfactant isolated from human amniotic fluid forms highly condensed interfacial films.Physiol Rep. 2025 Jun;13(12):e70403. doi: 10.14814/phy2.70403. Physiol Rep. 2025. PMID: 40538095 Free PMC article.
-
Organoid-based expansion of patient-derived primary alveolar type 2 cells for establishment of alveolus epithelial Lung-Chip cultures.Am J Physiol Lung Cell Mol Physiol. 2022 Apr 1;322(4):L526-L538. doi: 10.1152/ajplung.00153.2021. Epub 2022 Feb 9. Am J Physiol Lung Cell Mol Physiol. 2022. PMID: 35137633 Free PMC article.
-
Interfacial sensing by alveolar type II cells: a new concept in lung physiology?Am J Physiol Cell Physiol. 2011 Jun;300(6):C1456-65. doi: 10.1152/ajpcell.00427.2010. Epub 2011 Jan 26. Am J Physiol Cell Physiol. 2011. PMID: 21270294 Free PMC article.
-
Human decidua-derived mesenchymal stem cells differentiate into functional alveolar type II-like cells that synthesize and secrete pulmonary surfactant complexes.PLoS One. 2014 Oct 15;9(10):e110195. doi: 10.1371/journal.pone.0110195. eCollection 2014. PLoS One. 2014. PMID: 25333871 Free PMC article.
References
-
- Pérez-Gil J. (2008) Biochim. Biophys. Acta 1778, 1676–1695 - PubMed
-
- Haller T., Dietl P., Stockner H., Frick M., Mair N., Tinhofer I., Ritsch A., Enhorning G., Putz G. (2004) Am. J. Physiol. Lung Cell. Mol. Physiol. 286, L1009–L1015 - PubMed
-
- Kashchiev D., Exerowa D. (2001) Eur. Biophys. J. 30, 34–41 - PubMed
-
- Sato S., Kishikawa T. (2001) Med. Electron Microsc. 34, 142–151 - PubMed
-
- Veldhuizen R. A., Yao L. J., Lewis J. F. (1999) Exp. Lung Res. 25, 127–141 - PubMed
Publication types
MeSH terms
Substances
Grants and funding
LinkOut - more resources
Full Text Sources
