. 2010 Aug 13;285(33):25458-66.
doi: 10.1074/jbc.M110.139345. Epub 2010 Jun 17.

Secreted heat shock protein 90alpha induces colorectal cancer cell invasion through CD91/LRP-1 and NF-kappaB-mediated integrin alphaV expression

Affiliations

Secreted heat shock protein 90alpha induces colorectal cancer cell invasion through CD91/LRP-1 and NF-kappaB-mediated integrin alphaV expression

Jinn-Shiun Chen et al. J Biol Chem. .

Abstract

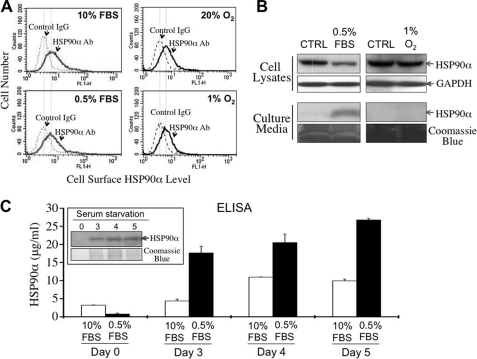
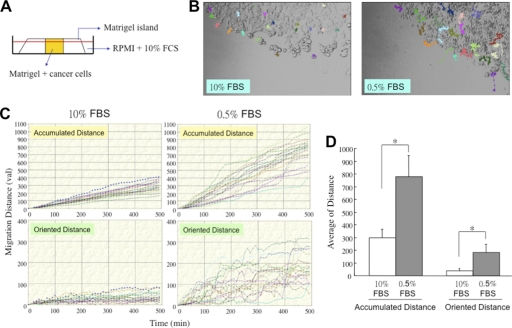
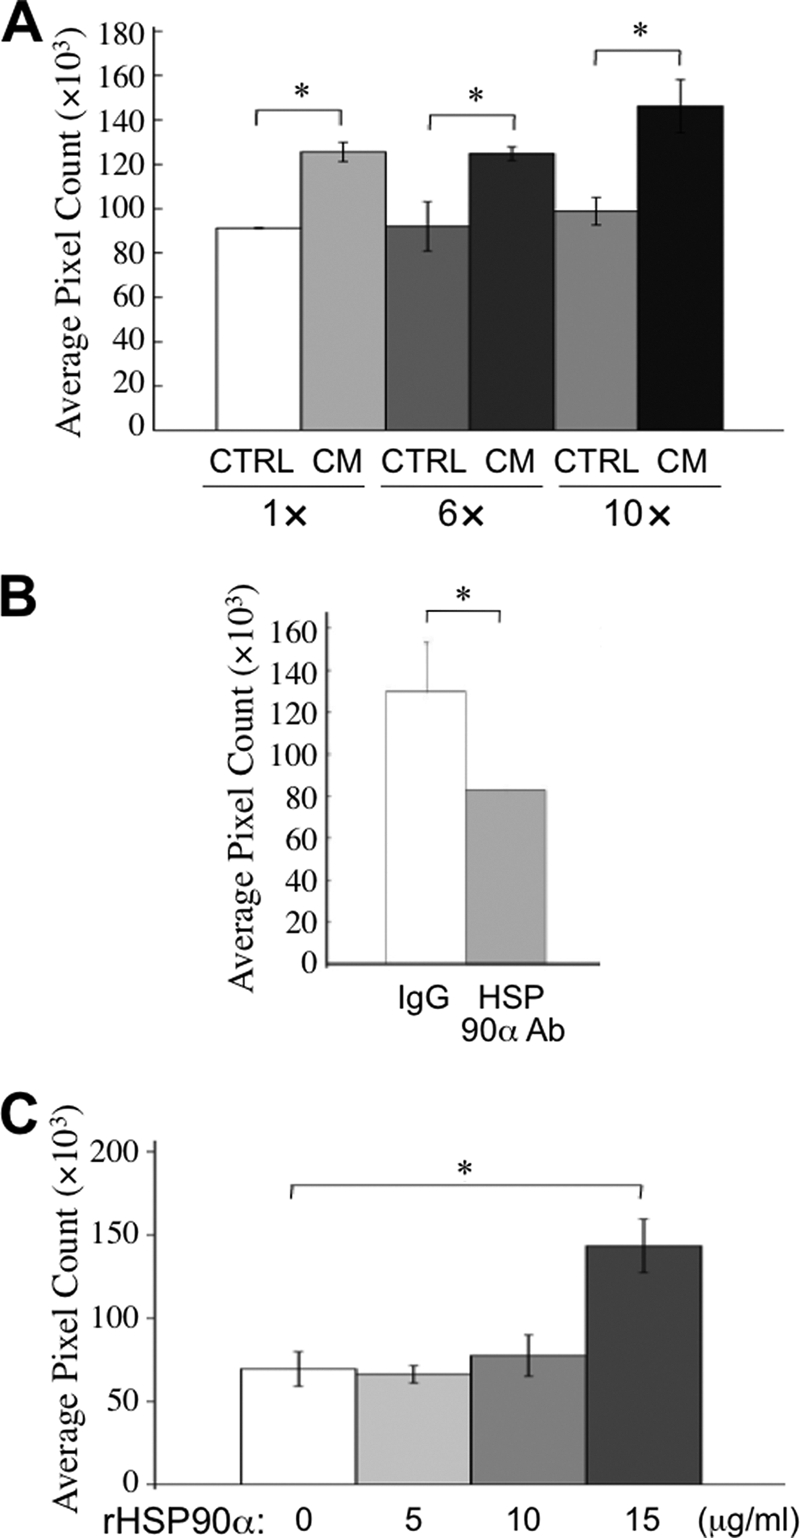
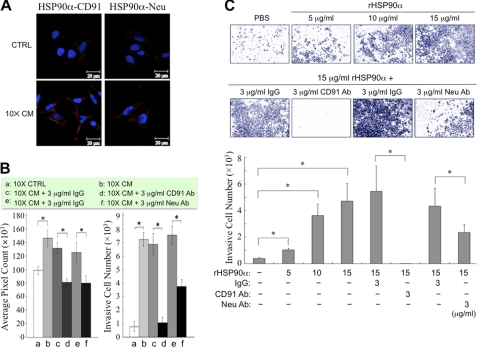
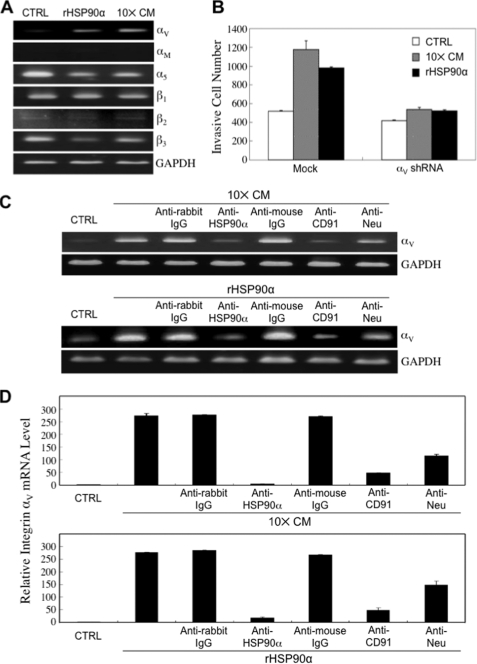
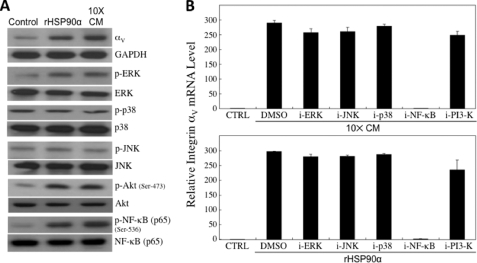
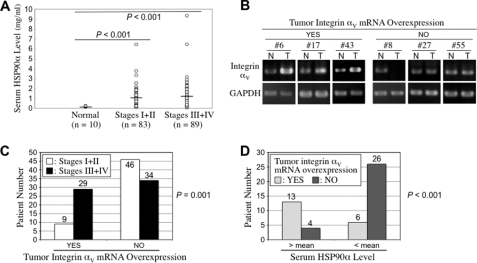
HCT-8 colon cancer cells secreted heat shock protein 90alpha (HSP90alpha) and had increased invasiveness upon serum starvation. The concentrated conditioned medium of serum-starved HCT-8 cells was able to stimulate the migration and invasion of non-serum-starved cells, which could be prevented by treatment with an anti-HSP90alpha antibody. Recombinant HSP90alpha (rHSP90alpha) also enhanced HCT-8 cell migration and invasion, suggesting a stimulatory role of secreted HSP90alpha in cancer malignancy. HSP90alpha binding to CD91alpha and Neu was evidenced by the proximity ligation assay, and rHSP90alpha-induced HCT-8 cell invasion could be suppressed by the addition of anti-CD91alpha or anti-Neu antibodies. Via CD91alpha and Neu, rHSP90alpha selectively induced integrin alpha(V) expression, and knockdown of integrin alpha(V) efficiently blocked rHSP90alpha-induced HCT-8 cell invasion. rHSP90alpha induced the activities of ERK, PI3K/Akt, and NF-kappaB p65, but only NF-kappaB activation was involved in HSP90alpha-induced integrin alpha(V) expression. Additionally, we investigated the serum levels of HSP90alpha and the expression status of tumor integrin alpha(V) mRNA in colorectal cancer patients. Serum HSP90alpha levels of colorectal cancer patients were significantly higher than those of normal volunteers (p < 0.001). Patients with higher serum HSP90alpha levels significantly exhibited elevated levels of integrin alpha(V) mRNA in tumor tissues as compared with adjacent non-tumor tissues (p < 0.001). Furthermore, tumor integrin alpha(V) overexpression was significantly correlated with TNM (Tumor, Node, Metastasis) staging (p = 0.001).


Figures

FIGURE 1.
FIGURE 1.
HSP90α secretion induced by serum starvation. A, cell surface HSP90α levels of HCT-8 cells were not obviously changed by 24 h of hypoxia or 72 h of serum starvation. Ab, antibody. B, the level of HSP90α was decreased in the cell lysate but increased in the culture medium of HCT-8 cells after serum starvation but not hypoxia. GAPDH, glyceraldehyde-3-phosphate dehydrogenase. C, measurement of the secreted amounts of HSP90α in culture media by ELISA. The data shown are the mean ± S.E. of three independent experiments. Approximately 18 and 27 μg/ml HSP90α was detected from the 3- and 5-day serum starvation media, respectively. In normally cultured cells, an increase of HSP90α (from 3 to 11 μg/ml) was detected from the 4-day culture medium. The amount of HSP90α was no more increased in the 5-day culture medium. The inset is a representative immunoblot result to confirm the immunoreactive specificity of the assays.
FIGURE 2.
FIGURE 2.
HCT-8 cell invasion induced by serum starvation. A, setup of Matrigel island invasion assay. HCT-8 cells were serum-starved for 3 days and seeded into the central part of a Matrigel island around which 10% fetal calf serum (10% FCS)-containing medium was added. B, cell invasion tracks of normally growing or serum-starved HCT-8 cells. Time-lapse photography was performed to monitor an 8-h process of Matrigel island invasion. From the series of photos, we analyzed the movement tracks of 20 randomly selected normally growing or serum-starved HCT-8 cells by the Image-Pro Plus software. C, quantification of the accumulated and the oriented invasion distance of normally growing or serum-starved HCT-8 cells selected in B. val, value. D, comparison between normally growing and serum-starved HCT-8 cells about the average accumulated invasion distance and the average oriented invasion distance. The data are expressed as mean ± S.E., and differences in the data were considered significant if p < 0.05 (asterisk).
FIGURE 3.
FIGURE 3.
HCT-8 cell migration enhanced by secreted HSP90α. A, HCT-8 cell migration is enhanced by serum starvation CM. HCT-8 cells were serum-starved for 5 days and incubated with fresh serum-free RPMI medium for another 24 h. The medium was collected as CM and was 6- or 10-fold concentrated by an Amicon Ultracel-30k centrifugal filter. On the other side, HCT-8 cells plated in 6-well plates were grown to confluence. After wounding with a white tip, cells were washed twice with PBS and treated with original or concentrated CM at 37 °C for 16 h. Pictures were taken of cells that migrated into the wounded area, and results were quantified by the Image-Pro Plus version 5.0.2 software. The serum-free RPMI medium, which was incubated at 37 °C for 24 h, was used as control medium (CTRL). B, secreted HSP90α is involved in CM-induced HCT-8 cell migration. Confluent and wounded HCT-8 cells were treated with 10-fold concentrated CM in the presence of anti-HSP90α antibody. IgG (preimmune anti-rabbit immunoglobulin) was used as a control antibody. C, HCT-8 cell migration is enhanced by rHSP90α. To assay the enhancement of HCT-8 cell migration, confluent and wounded HCT-8 cells were treated with 5, 10, or 15 μg/ml rHSP90α. The data are expressed as mean ± S.E., and differences in the data were considered significant if p < 0.05 (asterisk).
FIGURE 4.
FIGURE 4.
Involvement of CD91α and Neu in HSP90α-induced cancer cell migration and invasion. A, direct interaction of HSP90α with CD91α and Neu. HCT-8 cells were treated with 10× CM for 16 h and then double-stained with anti-HSP90α antibody and the antibody against CD91α or Neu followed by the proximity ligation assay. Nuclei were counterstained with 4′,6′-diamidino-2-phenylindole, and the images were obtained by confocal microscopy. The red fluorescence resulted from the direct contact of HSP90α with CD91α or Neu. B, CD91α and Neu are involved in 10× CM-induced HCT-8 cell migration and invasion. HCT-8 cells were treated with 10× CM in the presence of anti-CD91α or anti-Neu antibody for assaying cell migration (by conventional wound healing assay, left panel) and cell invasion (by Transwell invasion assay, right panel). CTRL, control medium. C, CD91α and Neu are involved in rHSP90α-induced HCT-8 cell invasion. HCT-8 cells, treated with rHSP90α in the presence of anti-CD91α (CD91 Ab) or anti-Neu antibodies (Neu Ab), were seeded in the top chambers of the Transwell inserts. Cells were allowed to invade for 24 h through Matrigel toward RPMI medium supplemented with 10% FBS in the bottom chambers. The filters of Transwell inserts were then fixed and stained with Giemsa, pictures were taken of the invasive cells on the filters (upper panel), and cells were counted by the Image-Pro Plus software (bottom panel). In B and C, the data are expressed as mean ± S.E., and differences in the data were considered significant if p < 0.05 (asterisk).
FIGURE 5.
FIGURE 5.
Integrin αV involved in HSP90α-induced cancer cell invasion. A, induction of integrin αV mRNA by rHSP90α and 10× CM. The mRNA levels of integrin αV, αM, α5, β1, β2, and β3 were analyzed by RT-PCR in HCT-8 cells treated with 10× CM or 15 μg/ml rHSP90α for 16 h. Both rHSP90α and 10× CM induced the mRNA expression of integrin αV but not other tested integrins. The representative results from three independent experiments are shown. CTRL, control medium; GAPDH, glyceraldehyde-3-phosphate dehydrogenase. B, expression of integrin αV is involved in rHSP90α and 10× CM-induced HCT-8 cell invasion. Induction of cell invasiveness by rHSP90α or 10× CM was drastically blocked when integrin αV shRNA was stably expressed in HCT-8 cells (p = 0.004 and 0.021, respectively). The data are the mean ± S.D. of three independent experiments. C, CD91 and Neu are involved in HSP90α-induced integrin αV expression. HCT-8 cells were treated 16 h with 10× CM or 15 μg/ml rHSP90α in the presence of 3 μg/ml anti-HSP90α, anti-CD91α, or anti-Neu antibodies for assaying the levels of integrin αV mRNA expression. The representative results from three independent experiments are shown. D, results of the quantitative RT-PCR analyses of the integrin αV mRNA levels in HCT-8 cells treated with 10× CM or 15 μg/ml rHSP90α in the presence of 3 μg/ml anti-HSP90α, anti-CD91α, or anti-Neu antibodies. The data are the mean ± S.D. of three independent experiments.
FIGURE 6.
FIGURE 6.
NF-κB-mediated signaling pathway involved in 10× CM- and rHSP90α-induced integrin αV expression. A, Western blot analyses of the phosphorylated (P) (active) levels of ERK, JNK, p38MAPK, Akt, and NF-κB p65 in HCT-8 cells treated with 10× CM or serum-free medium plus 15 μg/ml rHSP90α for 2 h. The representative results from three independent experiments are shown. GAPDH, glyceraldehyde-3-phosphate dehydrogenase. B, results of the quantitative RT-PCR analyses of the integrin αV mRNA levels in HCT-8 cells treated with 10× CM or 15 μg/ml rHSP90α in the presence of the inhibitors against ERK (PD98059, 5 μm), JNK (SP600125, 5 μm), p38MAPK (SB202190, 5 μm), NF-κB (6-amino-4-(4-phenoxyphenylethylamino) quinazoline, 100 nm), or PI3K (Ly294002, 50 μm) pathways. Both 10× CM-induced and rHSP90α-induced integrin αV expression were blocked only by the NF-κB inhibitor but not other inhibitors. The data shown are the mean ± S.D. of three independent experiments.
FIGURE 7.
FIGURE 7.
Elevated serum HSP90α levels and tumor integrin αV overexpression in CRC patients. A, serum HSP90α levels were detected from 10 normal volunteers and 172 CRC patients. Normal volunteers had an average HSP90α level of 0.18 ± 0.05 mg/ml, which was significantly lower than that of CRC patients (1.09 ± 1.14 mg/ml, p < 0.001). The HSP90α levels of low stage (TNM I + II) patients and high stage (TNM III + IV) patients were 1.00 ± 0.93 and 1.17 ± 1.30 mg/ml, respectively. The difference between low stage and high stage patients was not statistically significant (p = 0.328). B, increased integrin αV mRNA expression occurred in the tumor tissues of CRC patients. The mRNA levels of integrin αV were analyzed from paired tumor (T) and non-tumor (N) tissues of 118 CRC patients. The results from six patients are shown as representative examples. Quantitative RT-PCR analyses of integrin αV mRNA levels were performed and normalized to glyceraldehyde-3-phosphate dehydrogenase (GAPDH). Tumor integrin αV was considered to be overexpressed if the integrin αV level of tumor tissue was at least 2-fold higher than that of the corresponding non-tumor tissue. C, the Pearson chi-square analysis reveals that tumor integrin αV mRNA overexpression was significantly correlated with the TNM staging of CRC (p = 0.001). D, higher serum levels of HSP90α were significantly correlated with tumor integrin αV mRNA overexpression. Forty-nine patients were analyzed for levels of both serum HSP90α and tissue integrin αV mRNA. The Pearson chi-square analysis reveals that patients with higher serum HSP90α levels significantly exhibited elevated levels of integrin αV mRNA in their tumor tissues as compared with adjacent non-tumor tissues (r = 0.564, p < 0.001). Tumor integrin αV overexpression occurring in this patient group was significantly associated with the TNM staging of CRC (p = 0.004).

References

    1. Gething M. J., Sambrook J. (1992) Nature 355, 33–45 - PubMed
    1. Tsutsumi S., Neckers L. (2007) Cancer Sci. 98, 1536–1539 - PMC - PubMed
    1. Goetz M. P., Toft D. O., Ames M. M., Erlichman C. (2003) Ann. Oncol. 14, 1169–1176 - PubMed
    1. Sidera K., Samiotaki M., Yfanti E., Panayotou G., Patsavoudi E. (2004) J. Biol. Chem. 279, 45379–45388 - PubMed
    1. Becker B., Multhoff G., Farkas B., Wild P. J., Landthaler M., Stolz W., Vogt T. (2004) Exp. Dermatol. 13, 27–32 - PubMed

Publication types

MeSH terms