. 2010 Sep;109(3):804-19.
doi: 10.1152/japplphysiol.91429.2008. Epub 2010 Jun 17.

Hyperbaric hyperoxia and normobaric reoxygenation increase excitability and activate oxygen-induced potentiation in CA1 hippocampal neurons

Affiliations

Hyperbaric hyperoxia and normobaric reoxygenation increase excitability and activate oxygen-induced potentiation in CA1 hippocampal neurons

Alfredo J Garcia 3rd et al. J Appl Physiol (1985). 2010 Sep.

Abstract

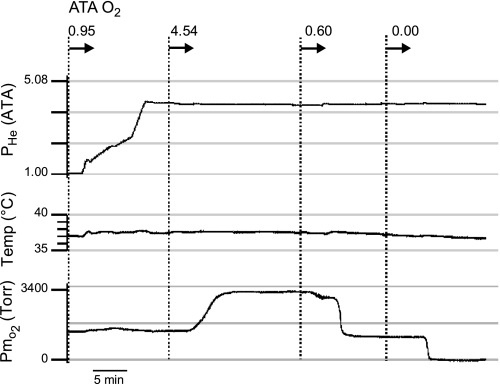
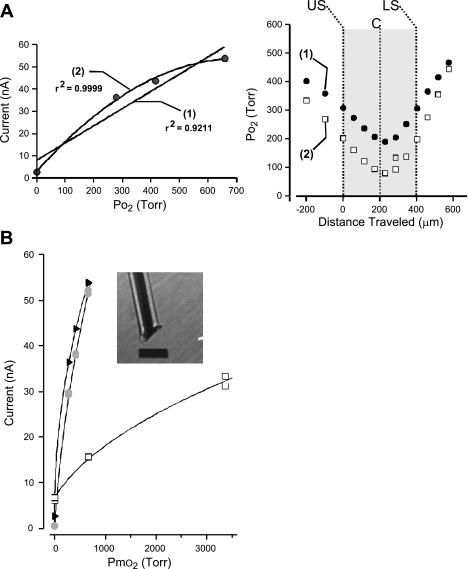
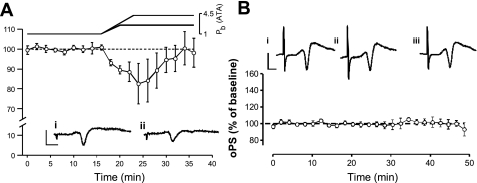
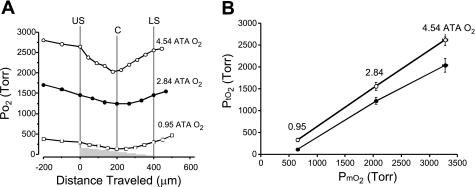
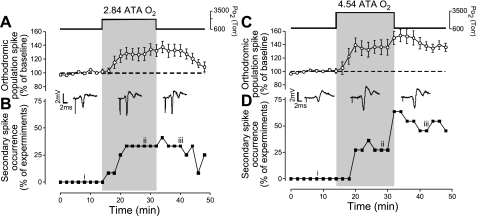
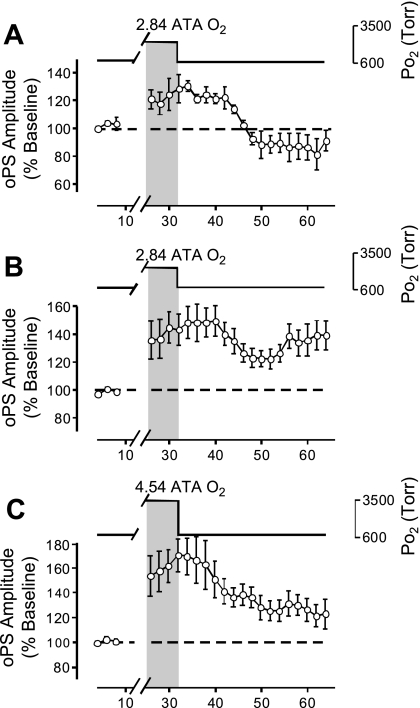
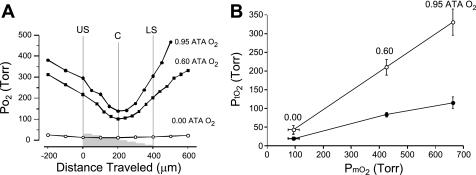
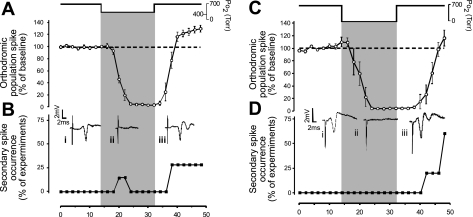
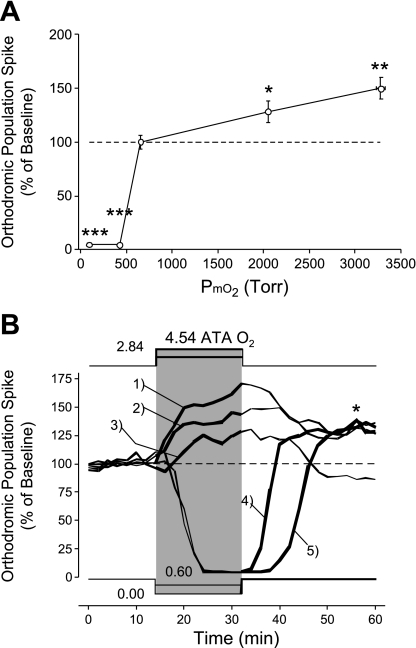
Breathing hyperbaric oxygen (HBO) is common practice in hyperbaric and diving medicine. The benefits of breathing HBO, however, are limited by the risk of central nervous system O2 toxicity, which presents as seizures. We tested the hypothesis that excitability increases in CA1 neurons of the rat hippocampal slice (400 microm) over a continuum of hyperoxia that spans normobaric and hyperbaric pressures. Amplitude changes of the orthodromic population spike were used to assess neuronal O2 sensitivity before, during, and following exposure to 0, 0.6, 0.95 (control), 2.84, and 4.54 atmospheres absolute (ATA) O2. Polarographic O2 electrodes were used to measure tissue slice PO2 (PtO2). In 0.95 ATA O2, core PtO2 at 200 microm deep was 115±16 Torr (mean±SE). Increasing O2 to 2.84 and 4.54 ATA increased core PtO2 to 1,222±77 and 2,037±157 Torr, respectively. HBO increased the orthodromic population spike amplitude and usually induced hyperexcitability (i.e., secondary population spikes) and, in addition, a long-lasting potentiation of the orthodromic population spike that we have termed "oxygen-induced potentiation" (OxIP). Exposure to 0.60 ATA O2 and hypoxia (0.00 ATA) decreased core PtO2 to 84±6 and 20±4 Torr, respectively, and abolished the orthodromic response. Reoxygenation from 0.0 or 0.6 ATA O2, however, usually produced a response similar to that of HBO: hyperexcitability and activation of OxIP. We conclude that CA1 neurons exhibit increased excitability and neural plasticity over a broad range of PtO2, which can be activated by a single, hyperoxic stimulus. We postulate that transient acute hyperoxia stimulus, whether caused by breathing HBO or reoxygenation following hypoxia (e.g., disordered breathing), is a powerful stimulant for orthodromic activity and neural plasticity in the CA1 hippocampus.


Figures

Fig. 1.
Fig. 1.
Temperature regulation and oxygenation of the artificial cerebrospinal fluid (aCSF) in the slice bath before and during helium compression and while at steady-state hyperbaric pressure (4.54 ATA He). During helium pressurization (top trace: 1 → 4.08 ATA He), both temperature (middle trace) and Po2 of the aCSF (bottom trace) in the brain slice bath remain stable. Hyperbaric helium, which is inert, is used to mimic the effects of hydrostatic compression (see text for further details). In this example, 3 of the 4 levels of test O2 are shown: 4.54, 0.6, and 0.0 ATA. Hence, the Po2 of the aCSF can be varied over a wide range while barometric pressure (i.e., helium pressure, Phe) remains unchanged. Media were equilibrated with 0.95, 0.60, and 0.00 ATA O2 at normobaric pressure and pumped to the brain slice at constant flow rate (∼2 ml/min) using an HPLC pump regardless of the level of ambient pressure (1 to ∼4.08 ATA He) produced by increasing Phe. In the actual study, however, 0.00 and 0.60 were administered to the brain slice at room pressure (normobaric pressure) with the chamber door open. Thus, in this example, the level of O2 measured in the aCSF (bottom trace) during exposure to “anoxia” (0.00 ATA) is lower than that reported in Table 1 (media O2 tension, PmO2) and Fig. 7A due to the lack of O2 from air (i.e., 100% He + 0% O2) diffusing into the brain slice bath. In contrast, with the chamber door open and the chamber's atmosphere replaced with air (i.e., 20% O2), then the level of PmO2 (and tissue O2 tension, PtO2) achieved is higher due to diffusion of O2 from the atmosphere into the aCSF and brain slice.
Fig. 2.
Fig. 2.
Calibration of O2 electrode and measurement of Po2 profiles in aCSF and tissue. A: a representative Po2 experiment using linear and curvilinear calibration functions to calculate Po2 of the tissue slice and aCSF. Left, the linear fitting function (1) of the calibration points overestimates Po2 over most of the range compared with the values derived using the curvilinear fitting function described by a second-degree polynomial (2). Right, plotting calculated Po2 values using either linear (1, solid circles) or curvilinear fitting functions (2, open squares) shows that although the general shape of the profiles are similar to one another, the calculated values can differ. Specifically, the calculated PtO2 values throughout the tissue slice (large shaded area: US, upper surface of slice; C, core of slice; LS, lower surface of slice) are greater when the linear fitting function is used compared with the values generated by the curvilinear function. B: curvilinear calibrations were used to describe the relationship between PmO2 and current generated at various polarization values. Examples of O2 electrode calibration plot (PmO2 vs. current generated) at 3 different polarization values: −675 mV (shaded circles), −640 mV (solid triangles), and −525 mV (open squares). Reduction of polarization potential reduced the amount of current generated per Torr O2. A second-degree polynomial equation was used to describe all calibration curves. Shown in the inset is the tip of the O2 electrode that was constructed from a platinum wire (50-μm outer diameter) insulated with Teflon (25 μm thick). The electrode's sensing surface was located at the end of the exposed wire and consisted of a bare platinum surface. Calibration bar = 125 μm.
Fig. 3.
Fig. 3.
Stability of the extracellular recording of the orthodromic population spike (oPS) in 0.95 ATA O2 during helium compression (A) and at steady-state pressure (B). A: before helium compression, air was flushed from the hyperbaric chamber and replaced with pure helium to avert any narcotic actions of hyperbaric N2. Helium compression of the chamber and slice bath to 2.41 or 4.51 ATA, while superfusing the slice with aCSF (PmO2 = 0.95 ATA O2), caused a transient depression of the oPS amplitude, which recovered back toward normobaric values after 10–12 min at steady-state hyperbaria. The amplitude of the oPS thereafter remained stable at hyperbaric pressure for an additional 16 min; e.g., see control periods in Fig. 5, A and C. On the basis of these results, the effect of compression on CA1 neuronal excitability was considered negligible under the steady-state hyperbaric conditions used in this study. Consequently, the control condition used for all hyperbaric oxygen (HBO) tests was PmO2 = 0.95 ATA O2 (in aCSF), and the chamber was pressurized to 2.41 or 4.11 ATA He. Raw data traces of the oPS correspond to the elapsed time at 14 (inset i) and 30 min (inset ii). Insets: calibration bars = 2 mV × 2 ms. B: data were collected from slices at normobaric pressure and both levels of hyperbaric pressure and were pooled together. Raw data traces of the oPS (top) correspond to the elapsed time at 4 (inset i), 22 (inset ii), and 40 min (inset iii). Note that no secondary spikes were observed (n = 5). The tightly grouped averaged data (bottom) indicate that the amplitude of the oPS response remained stable throughout the 50-min period under control conditions, which was the duration of the typical experiment. Insets: calibration bars = 2 mV × 2 ms.
Fig. 4.
Fig. 4.
Oxygen tension profiles measured in 400-μm-thick hippocampal slices during 2-sided superfusion in aCSF equilibrated with 0.95 ATA O2 (control) in an air atmosphere and HBO in a pure helium atmosphere. A: representative PmO2 and PtO2 profiles made at 0.95, 2.84, and 4.54 ATA O2 in 3 different brain slices. Each PtO2 profile measured at each level of PmO2 yielded a similar V-shaped profile that shifted upward as PmO2 was increased. At each level of PmO2 tested, the upper and lower surfaces of the slice had equivalent values, whereas the minimum Po2 measured occurred at the core of the brain slice. The values at the upper and lower surfaces of the slice were statistically different from the core values at 2.84 and 0.95 ATA O2; see Table 1 for further details. B: a plot of average upper surface (○) and core (●) PtO2 values in all slices tested as a function of the average PmO2 in the aCSF. Neurons in each slice are exposed to a range of PtO2 values, which is indicated by the vertical distance separating the 2 averaged values for the upper surface and core PtO2 values at each level of PmO2 tested.
Fig. 5.
Fig. 5.
Effects of HBO on the oPS amplitude and induction of secondary population spikes (sPS), which are indicative of hyperexcitability. A: acute exposure for 16 min to 2.84 ATA O2 stimulated the amplitude of the oPS (n = 12). This stimulation decayed to baseline after 16 min of recovery in control O2 (0.95 ATA). B: acute exposure to 2.84 ATA O2 induced sPS activity in some cases (n = 3/12) coincident with the increased amplitude of the oPS (A), which persisted into the recovery period. Representative raw data traces were sampled before (i), during (ii), and after exposure (iii) to 2.84 ATA O2, showing both the stimulation of the oPS amplitude and the onset of the sPS, which follows the primary spike. C: acute exposure to 4.54 ATA O2 increased the amplitude of the oPS (n = 11). This stimulatory effect of HBO, however, did not return to baseline level after 16 min of recovery in 0.95 ATA O2. The potentiation in the oPS following HBO exposure was referred to as “oxygen-induced potentiation” (OxIP) and suggests that a form of O2-dependent neural plasticity exists in the CA3 → CA1 hippocampal circuitry. D: acute exposure to 4.54 ATA O2 induced sPS hyperexcitability in a fraction of experiments during HBO, which persisted and increased throughout the recovery period in several of the slices (n = 5/11). Representative raw data traces of the oPS and sPS activity were sampled before (i), during (ii), and after exposure (iii) to 4.54 ATA O2.
Fig. 6.
Fig. 6.
The recovery period following HBO was extended from 16 to 32 min to determine the incidence of OxIP. Slices were divided into those that did not exhibit (A) and those that did exhibit OxIP (B and C). A: exposure to 2.84 ATA O2 induced 1 of 2 types of recovery patterns. As shown, a fraction of the slices tested (n = 4/10) exhibited full recovery of the oPS response that eventually undershoots the original baseline activity. B: exposure to 2.84 ATA O2 activated OxIP in over one-half of the slices tested (n = 6/10), which was sustained for at least 32 min. Four of 6 slices also exhibited sPS activity during HBO that was sustained throughout OxIP. This population of slices with OxIP of the oPS was not evident in Fig. 5A when all the data were pooled and a shorter recovery period was analyzed. C: exposure to the highest level of HBO tested (4.54 ATA O2) activated OxIP for at least 32 min in all of the slices tested (n = 6). Three of 6 slices also exhibited sPS activity during HBO that was sustained throughout OxIP.
Fig. 7.
Fig. 7.
Oxygen tension profiles measured in 400-μm-thick hippocampal slices during 2-sided superfusion in aCSF equilibrated with 0.95 (control), 0.60, and 0.00 ATA O2 in an overlying air atmosphere. A: representative PmO2 and PtO2 profiles made at 0.95, 0.60, and 0.00 ATA O2 in 3 different brain slices. Each of the PtO2 profiles measured at a level of PmO2 >0.00 ATA O2 yielded a similar V-shaped profile that shifted downward as PmO2 was decreased. At each level of O2 >0.00 ATA O2 tested, the upper and lower surfaces of the slice had equivalent values, whereas the minimum Po2 measured occurred at the core of the brain slice. At 0.00 ATA O2, however, the O2 profile appears to be flat compared with the V-shaped profiles observed at 0.60 ATA O2 and above. The values at the upper and lower surfaces of the slice were statistically different from the core values at 0.95 and 0.60 ATA O2; see Table 1 for further details. B: a plot of average upper surface (○) and core (●) PtO2 values in all slices tested as a function of the average PmO2 in the aCSF at normobaric pressure. Each slice is exposed to a range of PtO2, which is indicated by the vertical distance separating the 2 averaged values for upper surface and core PtO2 values at each O2 level tested. Notice that the values of PtO2 in control O2 (0.95 ATA) are hyperoxic (ranging from 115 to 330 Torr) compared with values for PtO2 measured in the intact central nervous system of an animal breathing normobaric air (see text). The data for 0.95 ATA O2 were also plotted in Fig. 4 on a compressed y-axis.
Fig. 8.
Fig. 8.
Effects of 0.6 and 0.00 ATA O2 and “normobaric reoxygenation” (NBOreox) on the oPS amplitude and induction of sPS hyperexcitability. A: acute exposure for 16 min to 0.60 ATA O2 completely inhibited the oPS response in all slices tested. The oPS response returned toward control activity on reoxygenation and overshot the original baseline by 30.2% after 16 min of recovery (n = 7), which we interpreted as OxIP. B: in parallel with the stimulation of the oPS amplitude during reoxygenation from 0.6 to 0.95 ATA O2, one-quarter of the slices tested also displayed sPS activity or hyperexcitability. Representative raw data traces were sampled before (i), during (ii), and after exposure (iii) to 0.60 ATA O2, showing the effects of O2 manipulation on the oPS and sPS activity. C: similar to the synaptic response to 0.60 ATA O2, acute exposure to 0.00 ATA O2 completely inhibited the oPS as previously reported by many investigators (see text). In contrast to the response in 0.6 ATA O2, recovery of the oPS response back toward control activity required a longer time. Eventually, after 14 min of recovery, the oPS fully returned and overshot baseline activity by 16.3%, which is more evident in Fig. 9B, trace 5, where a longer period of recovery is shown. D: in parallel with the stimulation of the oPS amplitude during reoxygenation from 0.00 to 0.95 ATA O2, one-half of the slices tested also displayed sPS hyperexcitability. Representative raw data traces were sampled before (i), during (ii), and after exposure (iii) to hypoxia, showing the effects of O2 manipulation on the oPS and sPS activity.
Fig. 9.
Fig. 9.
Summary of how orthodromic activity changes in CA1 neurons during and following O2 manipulation at normobaric and hyperbaric pressures. A: graph shows the effects of 16 min of O2 manipulation on the amplitude of the oPS with PmO2 = 0.95 ATA as the initial control O2 tension. The greatest O2 sensitivity occurs between 0.6 and 0.95 ATA (*P < 0.05; **P < 0.01; ***P < 0.001). Notice that CA1 excitability increases in a nonlinear fashion as the level of PmO2 used during O2 manipulation increases from 0.6 (∼380 Torr) through 4.54 ATA (∼3,280 Torr) O2. Both 0.0 and 0.6 ATA O2 completely blocked the oPS response. Orthodromically stimulated activity in the O2 range of 0.6 to 0.95 ATA is especially O2 sensitive (see text). B: data replotted from Figs. 5, 6, and 8 without the standard error bars. Notice that any hyperoxic stimulus (NBOreox and HBO), regardless of the initial PmO2 value, increases excitability for at least 16 min (and as long as 46 min). This point is emphasized with the use of thick lines in the PmO2 traces and oPS amplitude traces, which demarcate the time period when a hyperoxic stimulus, covering a different range of PmO2 each time, is being applied to the hippocampal slice. This includes initiating the hyperoxic stimulus from either 0.95 ATA O2 via HBO (oPS trace 1, 4.5 ATA O2; oPS trace 2, 2.8 ATA O2) or 0.60 ATA O2 (oPS trace 4) and 0.00 ATA O2 (oPS trace 5) via NBOreox. Trace 3 is the subsample of slices that did not exhibit OxIP following acute exposure to 2.8 ATA O2 (Fig. 6A). The asterisk highlights the similarity in magnitude of OxIP activated by HBO or NBOreox in oPS traces 1, 2, 4, and 5.

Similar articles

Cited by

References

    1. Aitken PG, Breese GR, Dudek FF, Edwards F, Espanol MT, Larkman PM, Lipton P, Newman GC, Nowak TSJ, Panizzon KL. Preparative methods for brain slices: a discussion. J Neurosci Methods 59: 139–149, 1995 - PubMed
    1. Alger BE, Dhanjal SS, Dingledine R, Garthwaite J, Henderson G, King GL, Lipton P, North A, Schwartzkronin PA, Sears TA, Segal M, Whittingham TS, Williams J. Appendix, brain slice methods. In: Brain Slices, edited by Dingledine R. New York: Plenum, 1984, p. 381–437
    1. Arieli R, Gutterman A. Recovery time constant in central nervous system O2 toxicity in the rat. Eur J Appl Physiol 75: 182–187, 1997 - PubMed
    1. Atkins CM, Sweatt JD. Reactive oxygen species mediate activity-dependent neuron-glia signaling in output fibers of the hippocampus. J Neurosci 19: 7241–7248, 1999 - PMC - PubMed
    1. Avshalumov MV, Rice ME. Activation of ATP-sensitive K+ (KATP) channels by H2O2 underlies glutamate-dependent inhibition of striatal dopamine release. Proc Natl Acad Sci USA 100: 11729–11734, 2003 - PMC - PubMed

Publication types