

Point-of-purchase price and education intervention to reduce consumption of sugary soft drinks
- PMID: 20558801
- PMCID: PMC2901278
- DOI: 10.2105/AJPH.2009.175687
Point-of-purchase price and education intervention to reduce consumption of sugary soft drinks
Abstract
Objectives: We investigated whether a price increase on regular (sugary) soft drinks and an educational intervention would reduce their sales.
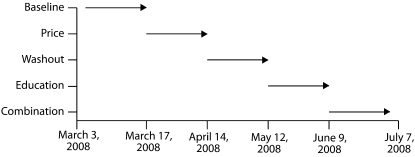
Methods: We implemented a 5-phase intervention at the Brigham and Women's Hospital cafeteria in Boston, Massachusetts. After posting existing prices of regular and diet soft drinks and water during baseline, we imposed several interventions in series: a price increase of 35% on regular soft drinks, a reversion to baseline prices (washout), an educational campaign, and a combination price and educational period. We collected data from a comparison site, Beth Israel Deaconess Hospital, also in Boston, for the final 3 phases.
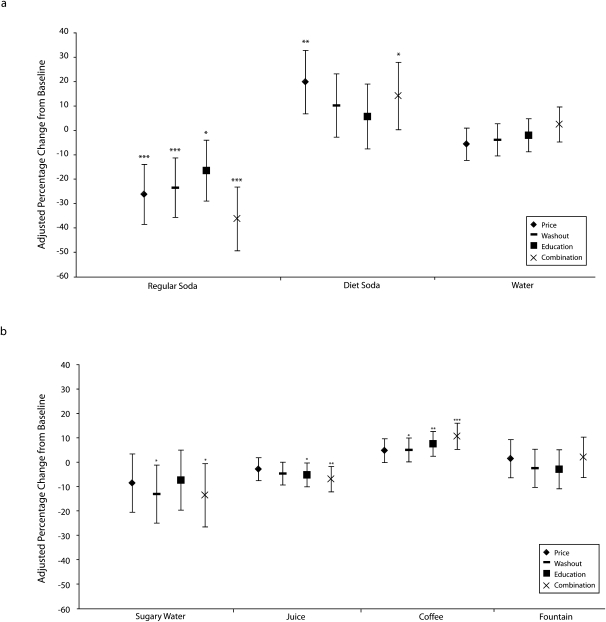
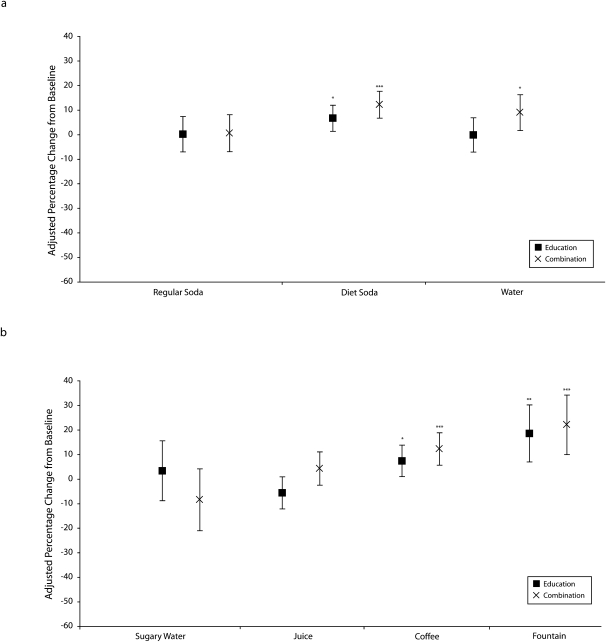
Results: Sales of regular soft drinks declined by 26% during the price increase phase. This reduction in sales persisted throughout the study period, with an additional decline of 18% during the combination phase compared with the washout period. Education had no independent effect on sales. Analysis of the comparison site showed no change in regular soft drink sales during the study period.
Conclusions: A price increase may be an effective policy mechanism to decrease sales of regular soda. Further multisite studies in varied populations are warranted to confirm these results.
Figures
References
-
- Block G. Foods contributing to energy intake in the US: data from NHANES III and NHANES 1999–2000. J Food Compost Anal 2004;17(3–4):439–447
-
- Nielsen SJ, Popkin BM. Changes in beverage intake between 1977 and 2001. Am J Prev Med 2004;27(3):205–210 - PubMed
-
- Schulze MB, Manson JE, Ludwig DS, et al. Sugar-sweetened beverages, weight gain, and incidence of type 2 diabetes in young and middle-aged women. JAMA 2004;292(8):927–934 - PubMed
-
- Dhingra R, Sullivan L, Jacques PF, et al. Soft drink consumption and risk of developing cardiometabolic risk factors and the metabolic syndrome in middle-aged adults in the community. Circulation 2007;116(5):480–488 - PubMed
-
- Ebbeling CB, Feldman HA, Osganian SK, et al. Effects of decreasing sugar-sweetened beverage consumption on body weight in adolescents: a randomized, controlled pilot study. Pediatrics 2006;117(3):673–680 - PubMed
Publication types
MeSH terms
Substances
Grants and funding
LinkOut - more resources
Full Text Sources
