. 2010 Aug 6;107(3):388-97.
doi: 10.1161/CIRCRESAHA.110.218651. Epub 2010 Jun 17.

P-selectin glycoprotein ligand-1 regulates adhesive properties of the endothelium and leukocyte trafficking into adipose tissue

Affiliations

P-selectin glycoprotein ligand-1 regulates adhesive properties of the endothelium and leukocyte trafficking into adipose tissue

Hana M Russo et al. Circ Res. .

Erratum in

  • Circ Res. 2010 Sep 17;107(6):e13. Gabriel, Núñez [corrected to Núñez, Gabriel]

Abstract

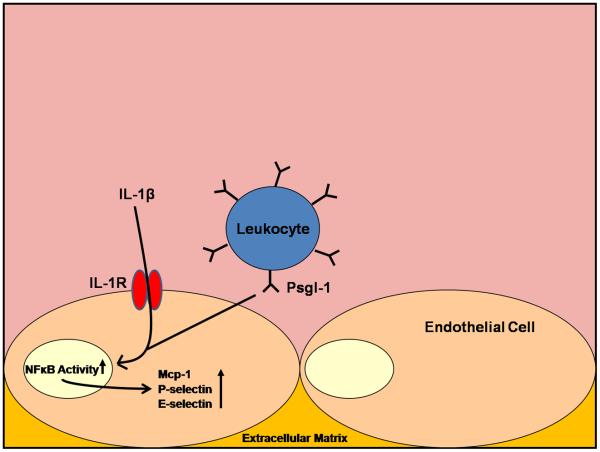
Rationale: Adhesive interactions between endothelial cells and leukocytes affect leukocyte trafficking in adipose tissue. The role of P-selectin glycoprotein ligand-1 (Psgl-1) in this process is unclear.

Objective: The goal of this study was to determine the effect of Psgl-1 deficiency on adhesive properties of the endothelium and on leukocyte recruitment into obese adipose depots.

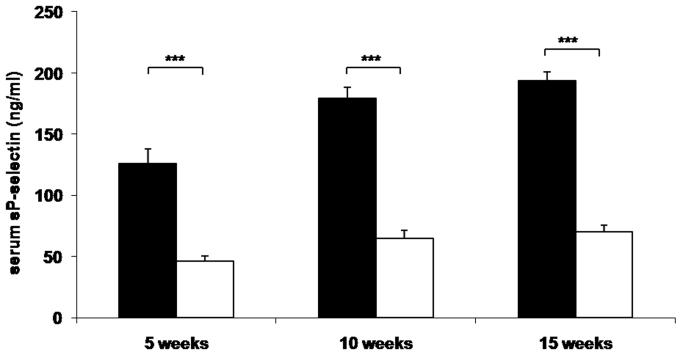
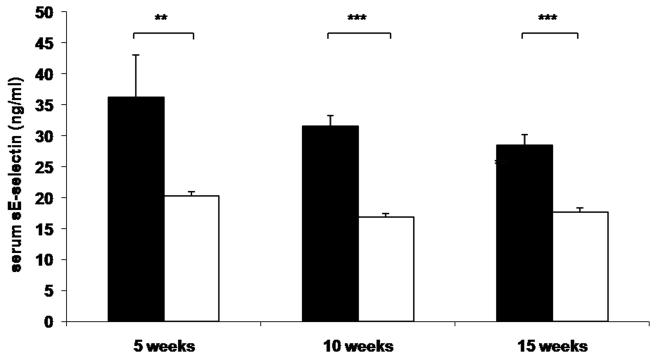
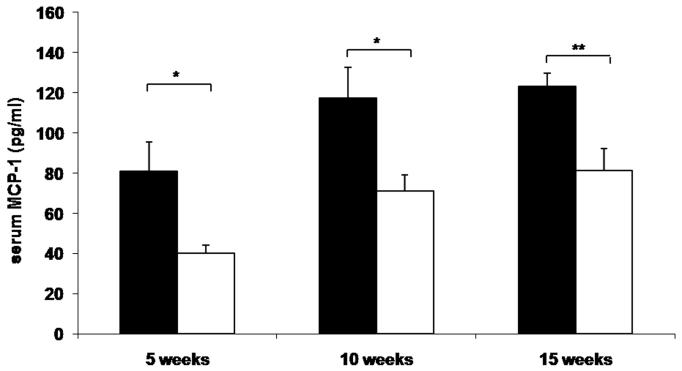
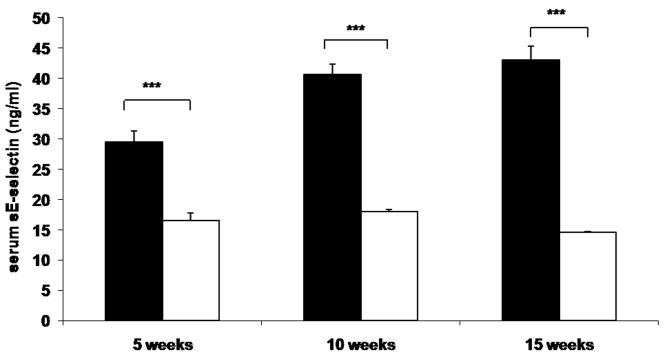
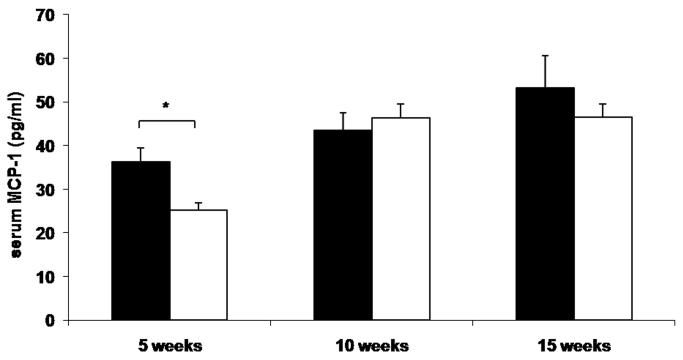
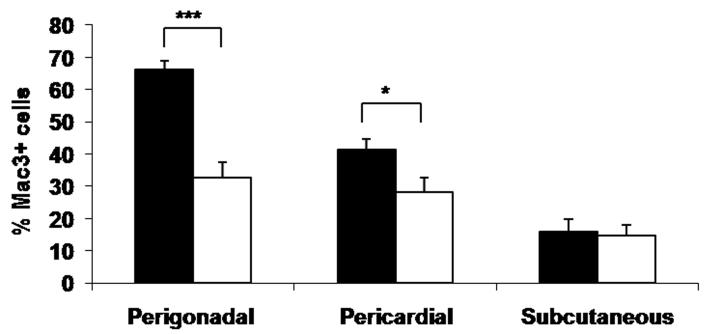
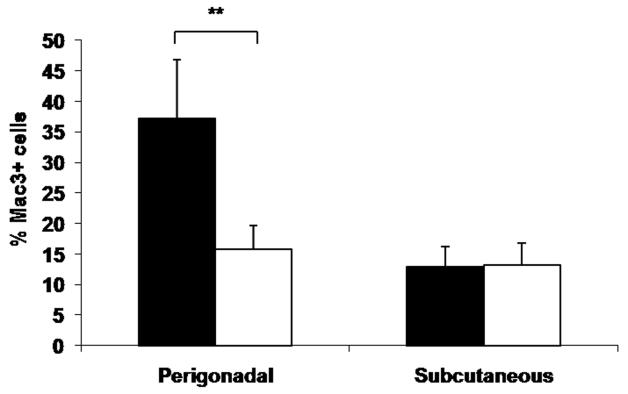
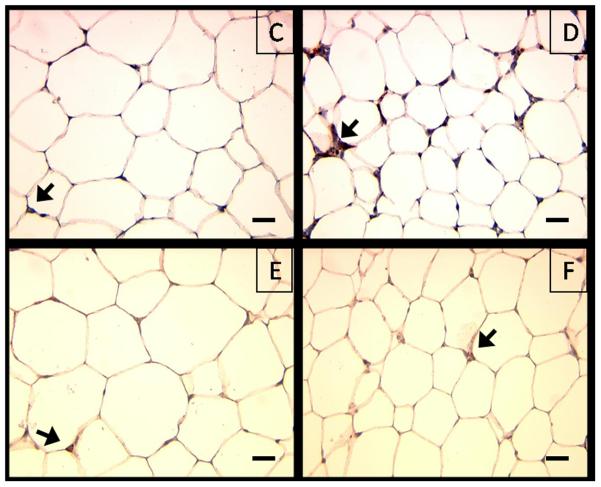
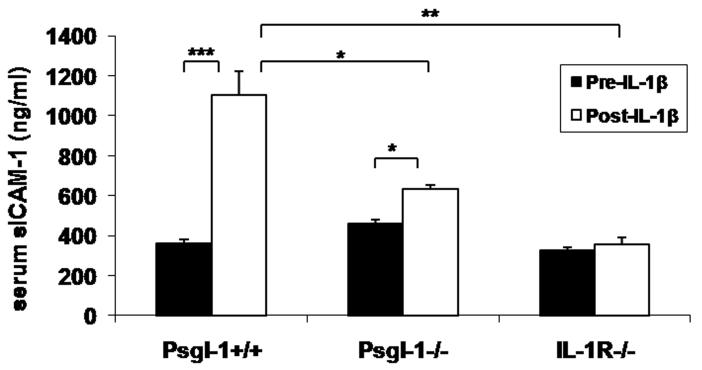
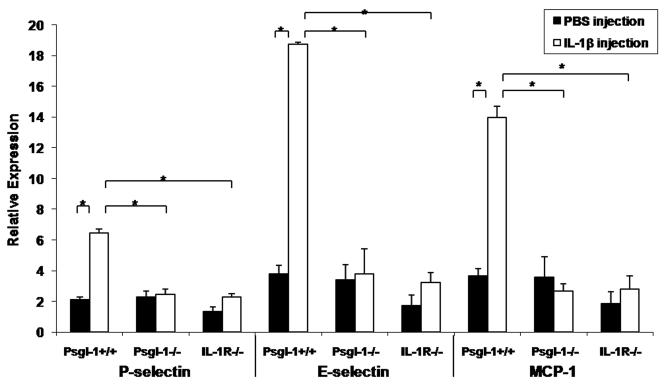
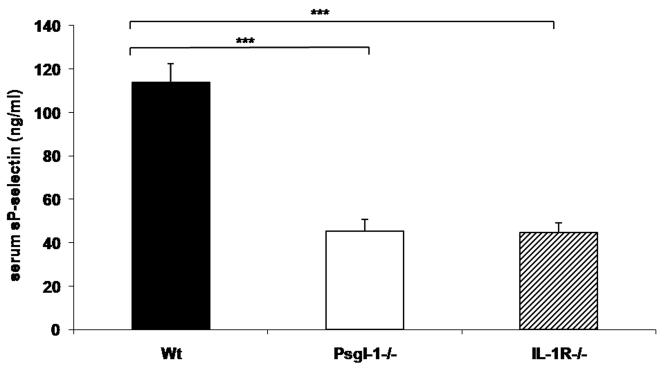
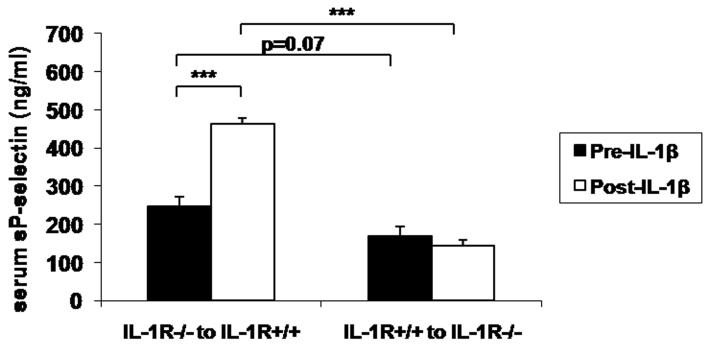
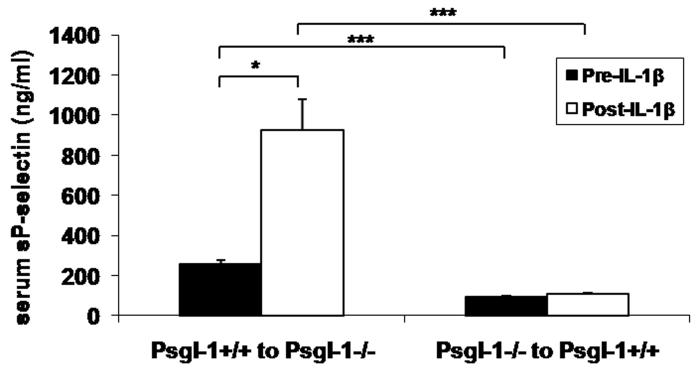
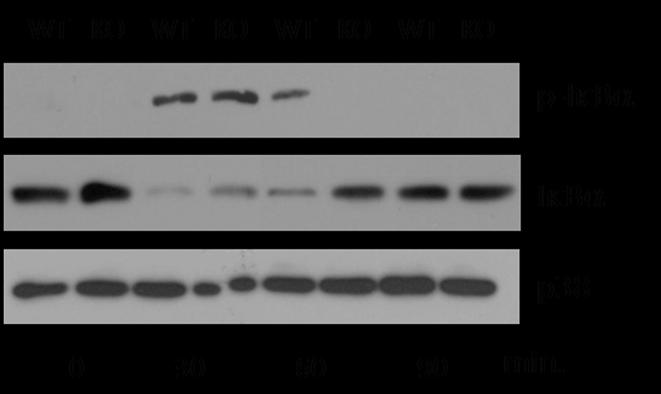
Methods and results: A genetic model of obesity was generated to study the effects of Psgl-1 deficiency on leukocyte trafficking. Leukocyte-endothelial interactions were increased in obese leptin receptor mutant mice (Lepr(db/db),Psgl-1(+/+)) but not obese Psgl-1-deficient mice (Lepr(db/db),Psgl-1(-/-)), when compared with lean mice (Lepr(+/+),Psgl-1(+/+)). This effect of Psgl-1 deficiency was due to indirect effects of Psgl-1, because Psgl-1(+/+) adoptively transferred leukocytes did not exhibit enhanced rolling in Lepr (db/db),Psgl-1(-/-) mice. Additionally, circulating levels of P-selectin, E-selectin, monocyte chemoattractant protein-1, and macrophage content of visceral adipose tissue were reduced in Lepr(db/db),Psgl-1(-/-) compared with Lepr(db/db),Psgl-1(+/+) mice. Reduced leukocyte-endothelial interactions and macrophage content of visceral adipose tissue due to Psgl-1 deficiency was also observed in a diet-induced obese mouse model. Psgl-1(-/-) mice were resistant to the endothelial effects of exogenous IL-1beta, suggesting that defective cytokine signaling contributes to the effect of Psgl-1 deficiency on leukocyte-endothelial interactions. Mice deficient in the IL-1 receptor also had reduced levels of circulating P-selectin, similar to those observed in Psgl-1(-/-) mice.

Conclusions: Deficiency of Psgl-1 is associated with reduced IL-1 receptor-mediated adhesive properties of the endothelium and is protective against visceral fat inflammation in obese mice.


Figures

Figure 1
Figure 1. Circulating sP-sel, sE-sel, and MCP-1 at 5, 10, and 15 weeks of age
Leprdb/db,Psgl-1+/+ (black bars) and Leprdb/db,Psgl-1−/− mice (white bars). Five week time point for Leprdb/db,Psgl-1+/+ mice (n=5-7). All other time points for Leprdb/db,Psgl-1+/+ and Leprdb/db, Psgl-1−/− mice (n=7-13). A) sP-sel levels. B) sE-sel levels. C) MCP-1 levels. Psgl-1+/+ (black bars) (n=5) and Psgl-1−/− mice (white bars) (n=3-5) on high-fat, high-sucrose diet. D) sP-sel levels. E) sE-sel levels. F) MCP-1 levels. *p<0.05, **p<0.01, ***p<0.001.
Figure 2
Figure 2. Macrophage content of perigonadal, pericardial, and subcutaneous adipose tissue
A) Macrophage content of perigonadal (n=7-10), pericardial (n=7-8), and subcutaneous (n=5-8) adipose tissue in Leprdb/db,Psgl-1+/+ (black bars) and Leprdb/db,Psgl-1−/− mice (white bars) at 15 weeks of age. B) Macrophage content of perigonadal and subcutaneous adipose tissue in Psgl-1+/+ (black bars) (n=4) and Psgl-1−/− mice (white bars) (n=5) after 10 weeks of high-fat, high-sucrose diet at 15 weeks of age. Representative cross sections of perigonadal adipose tissue from C) Psgl-1−/− and D) Psgl-1+/+ mice, and subcutaneous adipose tissue from E) Psgl-1−/− and F) Psgl-1+/+ mice 10 weeks after high-fat, high-sucrose diet. Staining with Mac3 antibody, magnification 40X, scale bar 200 μm, arrows showing stained cells. *p<0.05, **p<0.01, ***p<0.001.
Figure 3
Figure 3. Circulating sP-sel, sE-sel, MCP-1, and sICAM-1 and expression of P-sel, E-sel, and MCP-1 in lung and perigonadal fat 5 hours following IL-1β injection
Psgl-1+/+ (n=4), Psgl-1−/− (n=3), and IL-lR−/− mice (n=3). A) sP-sel levels, B) sE-sel levels, C) MCP-1 levels, and D) sICAM-1 levels in Psgl-1+/+, Psgl-1−/−, and IL-lR−/− mice before IL-1β challenge (black bar) and after IL-1β challenge (white bar). Expression of P-sel, E-sel, and MCP-1 in Psgl-1+/+, Psgl-1−/−, and IL-lR−/− in E) lung and in F) perigonadal fat following PBS injection (black bar) and following IL-1β challenge (white bar). * p<0.05, **p<0.01, ***p<0.001.
Figure 4
Figure 4. Circulating levels of sP-sel in mice at baseline
Wild-type (Wt) (black bar) (n=11), Psgl-1−/− (white bar) (n=10), and IL-1R−/− mice (diagonal striped bar) (n=15) ***p<0.001.
Figure 5
Figure 5. Relevant source of IL-1R and Psgl-1 for endothelial selectin regulation
A) sP-sel levels in IL-1R+/+ mice that had received IL-1R−/− bone marrow (n=4) and IL-1R−/− mice that had received IL-1R+/+ bone marrow (n=6) before IL-1β injection (black bars) and 5 hours following IL-1β injection (white bars). B) sP-sel levels in Psgl-1−/− mice that had received Psgl-1+/+ marrow (n=3) and Psgl-1+/+ mice that had received Psgl-1−/− marrow (n=6) before IL-1β injection (black bars) and 5 hours following IL-1β injection (white bars). *p<0.05. ***p<0.001.
Figure 6
Figure 6. Activation of NFκB in Psgl-1+/+ and Psgl-1−/− mice following IL-1β challenge
Extracts from total lung homogenates from Psgl-1+/+ (WT) and Psgl-1−/− (KO) mice were probed with antibodies that detect total and phosphorylated IκBα or p38.
Figure 7
Figure 7
Hematopoietic Psgl-1 regulates endothelial response to IL-1β

Similar articles

Cited by

References

    1. Jiao P, Chen Q, Shah S, Du J, Tao B, Tzameli I, Yan W, Xu H. Obesity-Related Upregulation of Monocyte Chemotactic Factors in Adipocytes: Involvement of Nuclear Factor-{kappa}B and c-Jun NH2-Terminal Kinase Pathways. Diabetes. 2009;58:104–115. - PMC - PubMed
    1. Weisberg SP, McCann D, Desai M, Rosenbaum M, Leibel RL, Ferrante AW., Jr Obesity is associated with macrophage accumulation in adipose tissue. J Clin Invest. 2003;112:1796–1808. - PMC - PubMed
    1. Wellen KE, Hotamisligil GS. Obesity-induced inflammatory changes in adipose tissue. J Clin Invest. 2003;112:1785–1788. - PMC - PubMed
    1. Xu H, Barnes GT, Yang Q, Tan G, Yang D, Chou CJ, Sole J, Nichols A, Ross JS, Tartaglia LA, Chen H. Chronic inflammation in fat plays a crucial role in the development of obesity-related insulin resistance. J Clin Invest. 2003;112:1821–1830. - PMC - PubMed
    1. Bullard DC. Adhesion molecules in inflammatory diseases: insights from knockout mice. Immunol Res. 2002;26:27–33. - PubMed

Publication types

MeSH terms