Comparative Study
. 2010 Aug 20;107(4):540-8.
doi: 10.1161/CIRCRESAHA.110.218404. Epub 2010 Jun 17.

Nitro-oleic acid inhibits angiotensin II-induced hypertension

Affiliations
Comparative Study

Nitro-oleic acid inhibits angiotensin II-induced hypertension

Jifeng Zhang et al. Circ Res. .

Abstract

Rationale: Nitro-oleic acid (OA-NO(2)) is a bioactive, nitric-oxide derived fatty acid with physiologically relevant vasculoprotective properties in vivo. OA-NO(2) exerts cell signaling actions as a result of its strong electrophilic nature and mediates pleiotropic cell responses in the vasculature.

Objective: The present study sought to investigate the protective role of OA-NO(2) in angiotensin (Ang) II-induced hypertension.

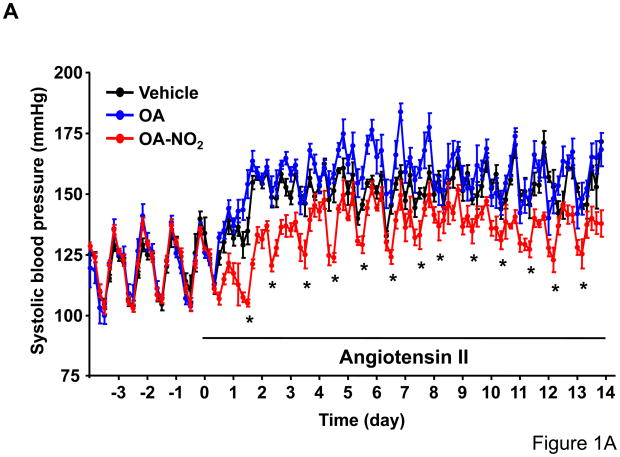
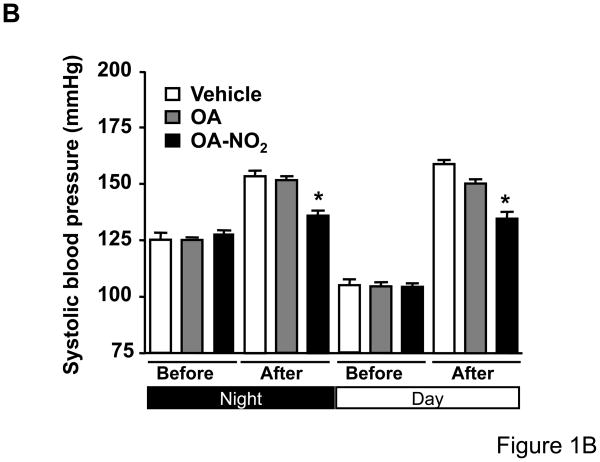
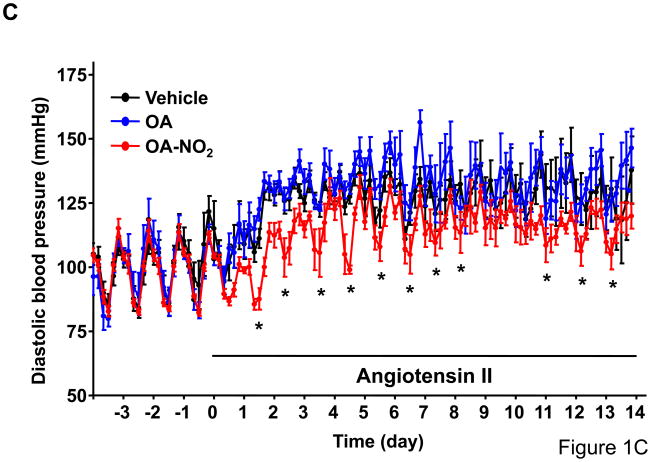
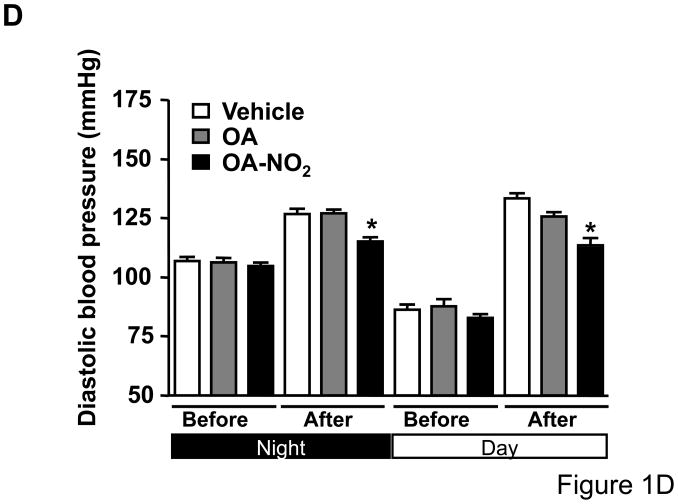
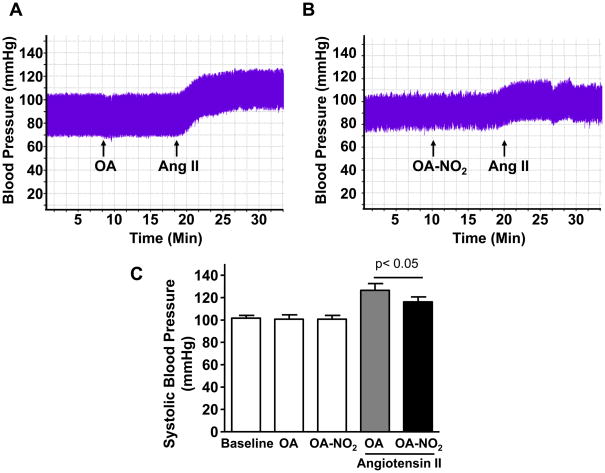
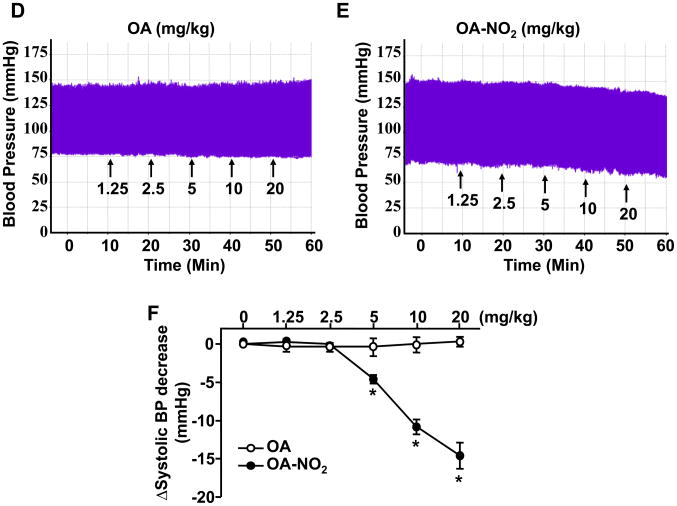
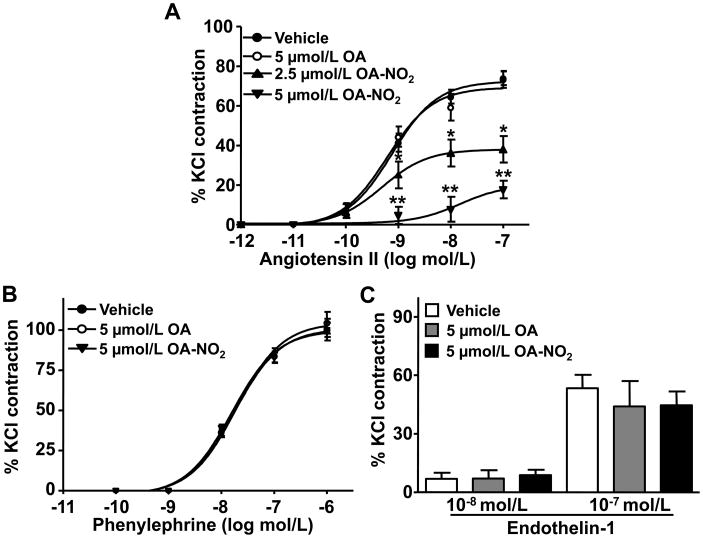
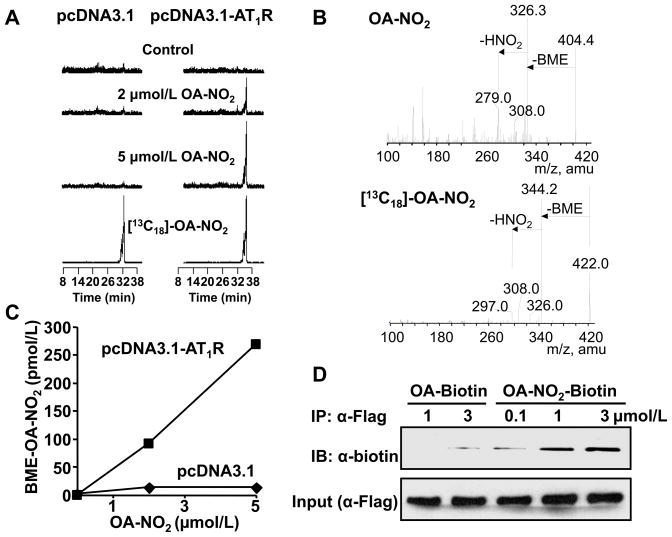
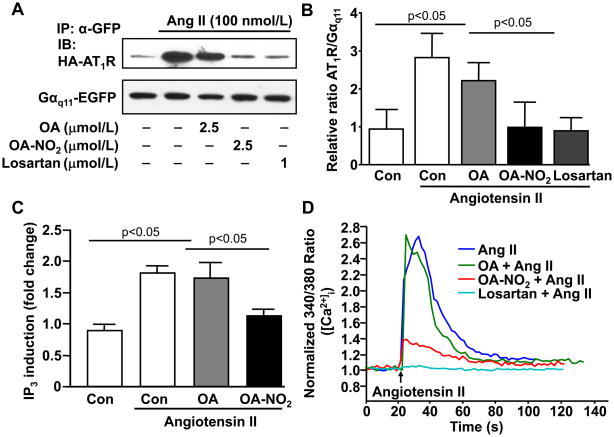
Methods and results: We show that systemic administration of OA-NO(2) results in a sustained reduction of Ang II-induced hypertension in mice and exerts a significant blood pressure lowering effect on preexisting hypertension established by Ang II infusion. OA-NO(2) significantly inhibits Ang II contractile response as compared to oleic acid (OA) in mesenteric vessels. The improved vasoconstriction is specific for the Ang II type 1 receptor (AT(1)R)-mediated signaling because vascular contraction by other G-protein-coupled receptors is not altered in response to OA-NO(2) treatment. From the mechanistic viewpoint, OA-NO(2) lowers Ang II-induced hypertension independently of peroxisome proliferation-activated receptor (PPAR)gamma activation. Rather, OA-NO(2), but not OA, specifically binds to the AT(1)R, reduces heterotrimeric G-protein coupling, and inhibits IP(3) (inositol-1,4,5-trisphosphate) and calcium mobilization, without inhibiting Ang II binding to the receptor.

Conclusions: These results demonstrate that OA-NO(2) diminishes the pressor response to Ang II and inhibits AT(1)R-dependent vasoconstriction, revealing OA-NO(2) as a novel antagonist of Ang II-induced hypertension.


Figures

Figure 1
Figure 1. OA-NO2 inhibits Ang II-induced hypertension
Mice implanted with osmotic pumps adjusted to deliver 5 mg/kg/day OA-NO2 (red) or OA (blue) and vehicle control (black) were infused with Ang II at a pressor rate of 500 ng/kg/min. Systolic (A) and diastolic (C) blood pressure was measured by radiotelemetry. Data are shown as mean ± SEM, n=6 in each group, *P < 0.05. OA-NO2-treated mice showed significantly lower systolic (~15 mmHg reduction) (B) and diastolic pressure (~12 mmHg reduction) (D) after Ang II challenge than did OA and vehicle-treated mice as determined both at the night and day time periods. Data in B and D are shown as mean ± SEM of measurements collected before (3 days) and after Ang II (12 days), n=6 in each group, *P < 0.05.
Figure 2
Figure 2. OA-NO2 inhibits the pressor response to Ang II
BP was monitored upon treatment with OA (A) and OA-NO2 (B) (10 mg/kg) before Ang II infusion (10μg/mL, infusion rate: 1μL/min). All drugs were delivered via jugular vein administration starting at the time indicated by the arrows. BP tracings were recorded by insertion of a micro-tip catheter sensor into the right carotid artery. (C) Systolic BP was averaged for a 10 min period before and after Ang II infusion (10μg/mL, infusion rate: 1μL/min). Data are shown as mean ± SEM, n=6 in each group. OA-NO2 significantly reduced the pressor response to Ang II infusion compared to OA. P < 0.05 (OA-NO2 vs. OA after Ang II infusion). (C) Hypertension was developed in mice in 3 days after implantation of osmotic pumps to infuse Ang II at a pressor rate of 500 ng/kg/min. OA (D) or OA-NO2 (E) were then delivered to mice via the jugular vein at increasing concentrations as indicated by the arrows. BP tracings were recorded as described above. (C) Data in D and E are summarized as systolic BP reduction (in mmHg) after either OA or OA-NO2 treatment as compared to maximal systolic pressure in Ang II hypertensive mice. OA-NO2 treatment but not OA dose-dependently reduced established hypertension upon Ang II delivery. Data are shown as mean ± SEM, n=4 in each group, *P < 0.05.
Figure 3
Figure 3. OA-NO2 reduces AT1R-dependent vessel contraction
Second-grade mesenteric artery rings were mounted into a myograph as described in the Online Material. The mesenteric artery rings were preincubated for 10 min with 2.5 μmol/L or 5 μmol/L of either OA or OA-NO2 as indicated. Vascular contraction was induced by serial addition of increasing concentrations of Ang II (A), PE (B) or ET-1 (C) to the myograph. Contractile response was quantified and shown in the figure as % of the vessel contraction force afforded by 50 mmol/L KCl. OA-NO2 dose-dependently reduced Ang II induced vasoconstriction but not that of PE or ET-1. Data are shown as mean ± SEM, n=6 in each group, *P < 0.05 and **P < 0.01 (OA-NO2 vs. OA or vehicle (0.1% ethanol-treated arteries).
Figure 4
Figure 4. OA-NO2 reduces Ang II-induced hypertension independently of PPARγ activation
BP in mice was monitored with a micro-tip catheter sensor inserted into the right carotid artery by arteriotomy upon treatment with OA (A) and OA-NO2 (B) (10 mg/kg) delivered via jugular vein administration after infusion of the PPARγ inhibitor, GW9662 (10 mg/kg). (A) and (B) show representative BP recordings of n=6 in each treatment before and after Ang II infusion (10μg/mL), delivered at an infusion rate of 1μL/min. (C) OA-NO2 delivery results in a significant reduction of Ang II-induced hypertension (~10 mmHg) independently of PPARγ inhibition by GW9662. Data are depicted as systolic BP increase (in mmHg) after Ang II infusion as compared to baseline systolic pressure and are shown as mean ± SEM, n=6 in each group, P < 0.01 (OA-NO2 vs. OA in either GW9662-treated or DMSO vehicle control-treated group after Ang II infusion). (D) The mesenteric artery rings were preincubated for 10 min with 10 μmol/L of GW9662 and then with 2.5 μmol/L of either OA or OA-NO2 as indicated. Vascular contraction was induced by serial addition of increasing concentrations of Ang II to the bath in the myograph. Contractile response was quantified and shown in the figure as % of the vessel contraction force afforded by 50 mmol/L KCl. OA-NO2 reduced Ang II induced vasoconstriction independent of the PPARγ antagonist, GW9662. Data are shown as mean ± SEM, n=6 in each group, *P < 0.05.
Figure 5
Figure 5. OA-NO2 forms covalent adducts with AT1R but does not affect Ang II binding to the receptor
(A) HEK293 cells were transfected with 500 ng FLAG-tagged AT1R plasmid (pcDNA3.1-AT1R) versus control plasmid (pcDNA3.1) and treated with OA or OA-NO2 as indicated. Immunoprecipitated AT1R was subjected to a BME-based trans-nitroalkylation reaction as detailed in the Online Material. Adducted OA-NO2 to AT1R was released as BME-OA-NO2 and quantified using mass spectrometry. The chromatographic profile shows a dose-dependent increase of OA-NO2 after immunoprecipitation against AT1R and verified by coelution with [13C18]-OA-NO2 internal standard (lower panel). (B) The fragmentation pattern (upper panel) of AT1R-derived OA-NO2 (5 μmol/L treatment) adducted to BME was confirmed by comparison with that of [13C18]-OA-NO2 (lower panel). Enhanced levels of the ion products in the peaks and comparison to the internal standard confirmed the structure for the proposed adducts formed after trans-nitroalkylation. The data shown is a representative set of 3 independent experimental repetitions. (C) Quantification of the AT1R-derived BME adducts after nucleophilic exchange of OA-NO2 from the AT1R to BME, reveal a significant increase of adducted OA-NO2 to the AT1R (270 pmol/L vs. 13 pmol/L BME-OA-NO2, respectively after 5 μmol/L OA-NO2 treatment). (D) HEK293 cells were similarly transfected with the pcDNA3.1-AT1R plasmid and treated with biotin-labeled OA-NO2 or OA for 3 h at the indicated concentrations. Biotin-labeled adducts were visualized by Western blot after immunoprecipitation of the Flag-AT1R. OA-NO2 dose-dependently increased the covalent adduction to the immunoprecipitated AT1R. The data shown is a representative set of 3 independent experimental repetitions. (E) Competition binding assays were performed using confluent VSMC pretreated with 2.5μmol/L of OA or OA-NO2 for 10 min and then incubated for 30 min with 0.3 nmol/L 125I-[Sar1,Ile8]-Ang II and different concentrations of non-radiolabeled Ang II as indicated. Data are shown as % of maximal binding with 125I-[Sar1,Ile8]-Ang II. (F) Similarly, VSMC treated with different doses of OA or OA-NO2 as indicated were then incubated for 30 min at 37°C with 0.1 nmol/L of 125I-[Sar1,Ile8]-Ang II. The ARB losartan (1μmol/L) served as a positive control. In panels E and F, radioactivity was measured using a γ-counter and values are expressed as mean ± SEM (n=4). The experiments were performed three times with similar results.
Figure 6
Figure 6. OA-NO2 uncouples Gαq11 to the AT1R and inhibits Ang II-induced IP3 production and Ca2+ mobilization in VSMC
(A) HEK293 cells cultured in 6-well plates were cotransfected with HA-tagged AT1R (0.3 μg), Gαq11-EGFP (0.3 μg), Gβ1 (0.1 μg) and Gγ2 (0.1 μg) plasmids and treated with either OA, OA-NO2 (2.5 μmol/L) or losartan (1μmol/L) 30min before stimulation with Ang II (100 nmol/L) for 1 min. Immunoprecipitated Gαq11 using a GFP antibody was subjected to deglycosylation before Western blot analysis for detection of HA-tagged AT1R. OA-NO2 but not OA reduced AT1R coupled to the immunoprecipitated Gαq11.The data shown is representative of 3 independent experiments. (B) Western blots were quantified using the ImageJ software after densitometric scanning of the films and expressed as relative ratio of AT1R vs. Gαq11. n=3. P < 0.05 OA-NO2 vs. OA in Ang II-treated cells and P < 0.05 Ang II-treated vs. vehicle control cells (Con). (C) VSMC were treated with either 2.5 μmol/L OA-NO2 or OA and then pulsed with 100 nmol/L Ang II for 45 min. IP3 production was monitored by radioreceptor assays. Ang II induced a 2-fold increase of intracellular IP3, whereas OA-NO2, but not OA blocked Ang II-mediated IP3 production, n=6. P < 0.05 OA-NO2 vs. OA in Ang II-treated cells and P < 0.05 Ang II-treated vs. vehicle control cells (Con). (B) VSMC were similarly treated with either OA-NO2 or OA (2.5μmol/L) and then pulsed with Ang II (100 nmol/L) in the presence of fura-2. Control experiments were performed with losartan (1 μmol/L) pretreated cells. Emission ratio between 340 nm and 380 nm was used to calculate intracellular calcium concentration as described in Online Material. The data shown depicts a representative time tracing of 6 independent experiments. The ratio-time traces were generated by averaging three typical cells in the field of view as described in Online Figure VI and Online Movies I through III).

Similar articles

Cited by

References

    1. Lundberg JO, Gladwin MT, Ahluwalia A, Benjamin N, Bryan NS, Butler A, Cabrales P, Fago A, Feelisch M, Ford PC, Freeman BA, Frenneaux M, Friedman J, Kelm M, Kevil CG, Kim-Shapiro DB, Kozlov AV, Lancaster JR, Jr, Lefer DJ, McColl K, McCurry K, Patel RP, Petersson J, Rassaf T, Reutov VP, Richter-Addo GB, Schechter A, Shiva S, Tsuchiya K, van Faassen EE, Webb AJ, Zuckerbraun BS, Zweier JL, Weitzberg E. Nitrate and nitrite in biology, nutrition and therapeutics. Nat Chem Biol. 2009;5:865–869. - PMC - PubMed
    1. Cosby K, Partovi KS, Crawford JH, Patel RP, Reiter CD, Martyr S, Yang BK, Waclawiw MA, Zalos G, Xu X, Huang KT, Shields H, Kim-Shapiro DB, Schechter AN, Cannon RO, 3rd, Gladwin MT. Nitrite reduction to nitric oxide by deoxyhemoglobin vasodilates the human circulation. Nat Med. 2003;9:1498–1505. - PubMed
    1. Jansson EA, Huang L, Malkey R, Govoni M, Nihlen C, Olsson A, Stensdotter M, Petersson J, Holm L, Weitzberg E, Lundberg JO. A mammalian functional nitrate reductase that regulates nitrite and nitric oxide homeostasis. Nat Chem Biol. 2008;4:411–417. - PubMed
    1. Baker PR, Schopfer FJ, O’Donnell VB, Freeman BA. Convergence of nitric oxide and lipid signaling: anti-inflammatory nitro-fatty acids. Free Radic Biol Med. 2009;46:989–1003. - PMC - PubMed
    1. Rudolph V, Schopfer FJ, Khoo NK, Rudolph TK, Cole MP, Woodcock SR, Bonacci G, Groeger AL, Golin-Bisello F, Chen CS, Baker PR, Freeman BA. Nitro-fatty acid metabolome: saturation, desaturation, beta-oxidation, and protein adduction. J Biol Chem. 2009;284:1461–1473. - PMC - PubMed

Publication types