. 2010 Jul 23;107(2):263-70.
doi: 10.1161/CIRCRESAHA.110.217299. Epub 2010 Jun 17.

Central and peripheral mechanisms of T-lymphocyte activation and vascular inflammation produced by angiotensin II-induced hypertension

Affiliations

Central and peripheral mechanisms of T-lymphocyte activation and vascular inflammation produced by angiotensin II-induced hypertension

Paul J Marvar et al. Circ Res. .

Abstract

Rationale: We have previously found that T lymphocytes are essential for development of angiotensin II-induced hypertension; however, the mechanisms responsible for T-cell activation in hypertension remain undefined.

Objective: We sought to study the roles of the CNS and pressure elevation in T-cell activation and vascular inflammation caused by angiotensin II.

Methods and results: To prevent the central actions of angiotensin II, we created anteroventral third cerebral ventricle (AV3V) lesions in mice. The elevation in blood pressure in response to angiotensin II was virtually eliminated by AV3V lesions, as was activation of circulating T cells and the vascular infiltration of leukocytes. In contrast, AV3V lesioning did not prevent the hypertension and T-cell activation caused by the peripheral acting agonist norepinephrine. To determine whether T-cell activation and vascular inflammation are attributable to central influences or are mediated by blood pressure elevation, we administered hydralazine (250 mg/L) in the drinking water. Hydralazine prevented the hypertension and abrogated the increase in circulating activated T cells and vascular infiltration of leukocytes caused by angiotensin II.

Conclusions: We conclude that the central and pressor effects of angiotensin II are critical for T-cell activation and development of vascular inflammation. These findings also support a feed-forward mechanism in which modest degrees of blood pressure elevation lead to T-cell activation, which in turn promotes inflammation and further raises blood pressure, leading to severe hypertension.


Figures
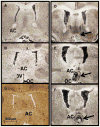
Figure 1
Figure 1. Coronal brain sections of anteroventral third ventricle (AV3V) lesioned and Sham-operated mice
Panels A–F depict brains from a representative single sham operated (AC) and AV3V lesioned (D–F) mouse. Coronal brain sections are at the level of 0.4 mm anterior to bregma according to the atlas of Paxinos and Franklin. Arrows point to the neuronal damage to the AV3V region. (AC, anterior commissure; OC, optic chiasm; 3V, third ventricle).
Figure 2
Figure 2. Effect of AV3V lesioning on hypertension and superoxide produced by angiotensin II
Panel A: Blood pressure measured by tail cuff following 0, 7, and 14 days of angiotensin II (ANG II) infusion. AV3V + ANG II (n=13), Sham + ANG II (n=13), AV3V + Vehicle (n=4), Sham + Vehicle (n=7). Panels B and C: Systolic and diastolic blood pressure measured by radiotelemetry. AV3V + ANG II (n=3), Sham + ANG II (n=5). Panel D: Aortic superoxide levels in Vehicle and Sham + ANG II and AV3V-lesioned mice (n = 5–8 in each group). (AV3V + ANG II vs Sham + Vehicle †; AV3V + ANG II vs Sham ANG II *; P<0.05) (Dashed Line represents Vehicle; Solid Line represents ANG II).
Figure 3
Figure 3. AV3V lesioning prevents angiotensin II-induced peripheral T cell activation and tissue infiltration
Percentage of circulating CD4+ lymphocytes expressing the early activation marker CD69 (Panel A) and tissue homing marker CD44 (Panel B) for sham-operated (n = 5–14) and AV3V-lesioned (n=5–11) mice. Total number of CD45+ leukocytes (Panel C) and CD3+ T cells (Panel D) in aortas of Sham-operated (n = 5–13) and AV3V-lesioned (n = 5–9) mice. Representative flow cytometric analysis of aortic CD45+ and CD3+ cells from sham-operated and AV3V lesioned groups (Panel E). Numbers in boxes represent a percent of the cell population that is positively labeled for the respective marker. (Vehicle vs ANG II *P<0.05) (Sham + ANG II vs AV3V + ANG II **P<0.05).
Figure 4
Figure 4. Norepinephrine (NE) induced hypertension promotes T cell activation and vascular inflammation independent of the AV3V region
Panel A: Blood pressure measured by tail cuff after 0,7, 14 days of NE infusion (AV3V n=4–6; Sham n= 5–7). Panel B–C: Percentage of circulating CD4+ lymphocytes expressing the early activation marker CD69 and the T cell tissue homing marker CD44 (AV3V n = 4–6; Sham n=5). Panel D-E: Total number of CD45+ leukocytes and CD3+ T cells in aortas of sham-operated (n=5–7) and AV3V lesioned (n=6–7) mice after 14 day infusion with vehicle or NE. Panel F: Blood Pressure in C57blk/6 and RAG1−/− mice at baseline and following vehicle or norepinephrine infusion for 14 days. Some RAG1−/− mice received adoptive transfer of T cells via retro-orbital injection (2×10⁷ cells) and norepinephrine infusion begun 3 weeks later (n=5–9/group). (*P<0.05 NE vs Vehicle) (AV3V and sham vehicle vs AV3V and sham NE **P<0.05).
Figure 5
Figure 5. Hydralazine prevents angiotensin II-induced hypertension, increased superoxide production, T cell activation and vascular inflammation
Panel A: Blood pressure measurements during 2 weeks of angiotensin II (ANG II) infusion and hydralazine (HYD) treatment (n = 8–10). Panel B: Aortic superoxide levels following ANG II infusion and HYD treatment (n = 5–11 in each group). Panel C–D: Percentage of circulating CD4+ lymphocytes expressing the early activation marker CD69 and the T cell tissue homing marker CD44 following ANG II and HYD treatment (n= 11–14). Panel (E–F) Absolute numbers of total leukocytes (CD45+) and total T cells (CD3+) in collagenase digested whole aortas following ANG II infusion and HYD treatment (n= 7–16) (*P<0.05 ANG II vs Vehicle) (†P<0.05 ANG II + HYD vs ANG II)(**P<0.05 Vehicle + HYD vs ANG II + HYD).
Figure 6
Figure 6. Hydralazine does not prevent circulating T cell activation in OT2 transgenic mice
Panel (A) The percentage of circulating CD4+ lymphocytes expressing the early activation marker CD69 and Panel (B) T cell tissue homing marker CD44 in OT transgenic mice immunized with ovalbumin (OVA) and vehicle aluminum hydroxide (Al(OH)3) (n = 3 OVA; n= 2 Al(OH)3). Control represents mice that did not receive hydralazine. (*P<0.05 OVA vs Al(OH)3 in control and hydralazine groups).

Comment in

References

    1. Chapleau MW, Abboud FM. Neuro-cardiovascular regulation: From molecules to man. Introduction. Ann N Y Acad Sci. 2001;940:xiii–xxii. - PubMed
    1. Guyenet PG. The sympathetic control of blood pressure. Nat Rev Neurosci. 2006;7:335–346. - PubMed
    1. Paton JF, Waki H, Abdala AP, Dickinson J, Kasparov S. Vascular-brain signaling in hypertension: Role of angiotensin ii and nitric oxide. Curr Hypertens Rep. 2007;9:242–247. - PubMed
    1. Zimmerman MC, Lazartigues E, Sharma RV, Davisson RL. Hypertension caused by angiotensin ii infusion involves increased superoxide production in the central nervous system. Circ Res. 2004;95:210–216. - PubMed
    1. Brody MJ, Johnson AK. Role of the anteroventral third ventricle region in fluid and electrolyte balance, arterial pressure regulation, and hypertension. New York: Frontiers in Neuroendocrinology Raven Press; 1980.

Publication types

MeSH terms