. 2010 Jun 17;465(7300):927-31.
doi: 10.1038/nature09079.

Fine-tuning of pre-balanced excitation and inhibition during auditory cortical development

Affiliations

Fine-tuning of pre-balanced excitation and inhibition during auditory cortical development

Yujiao J Sun et al. Nature. .

Abstract

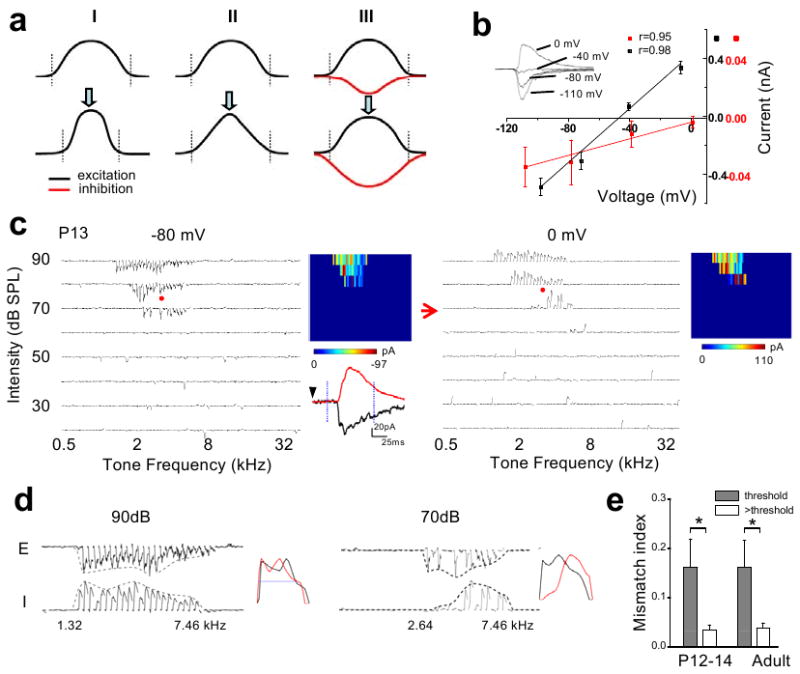
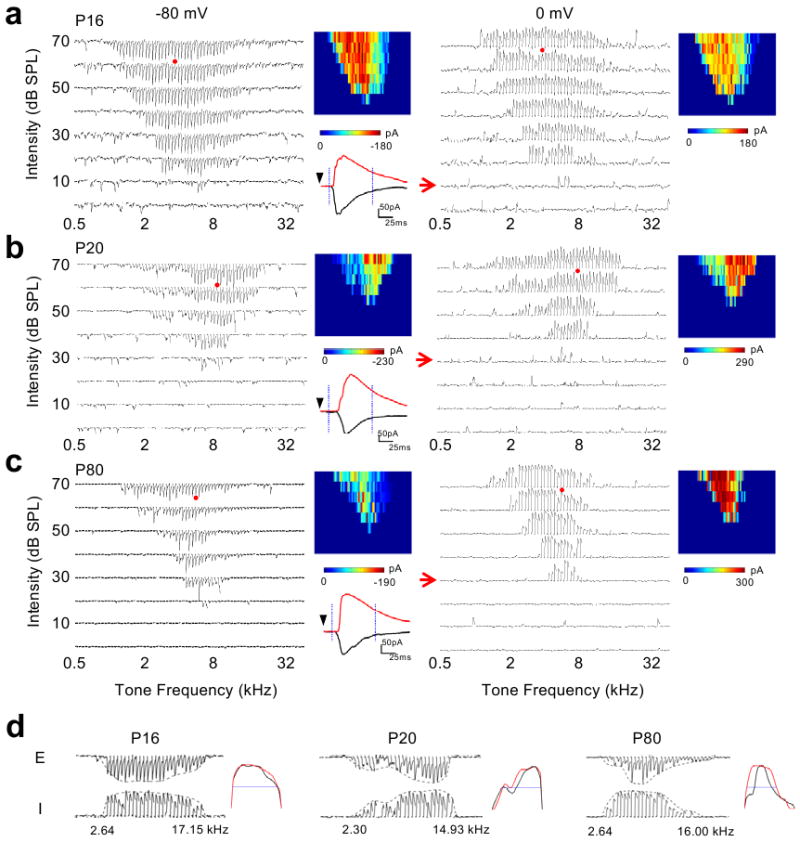
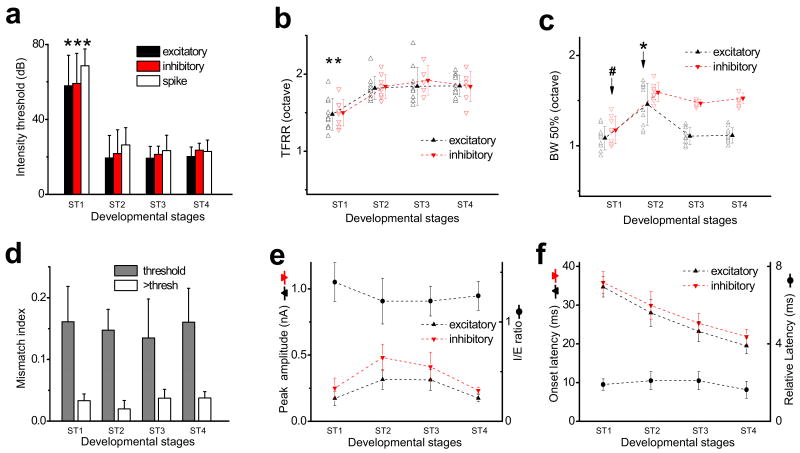
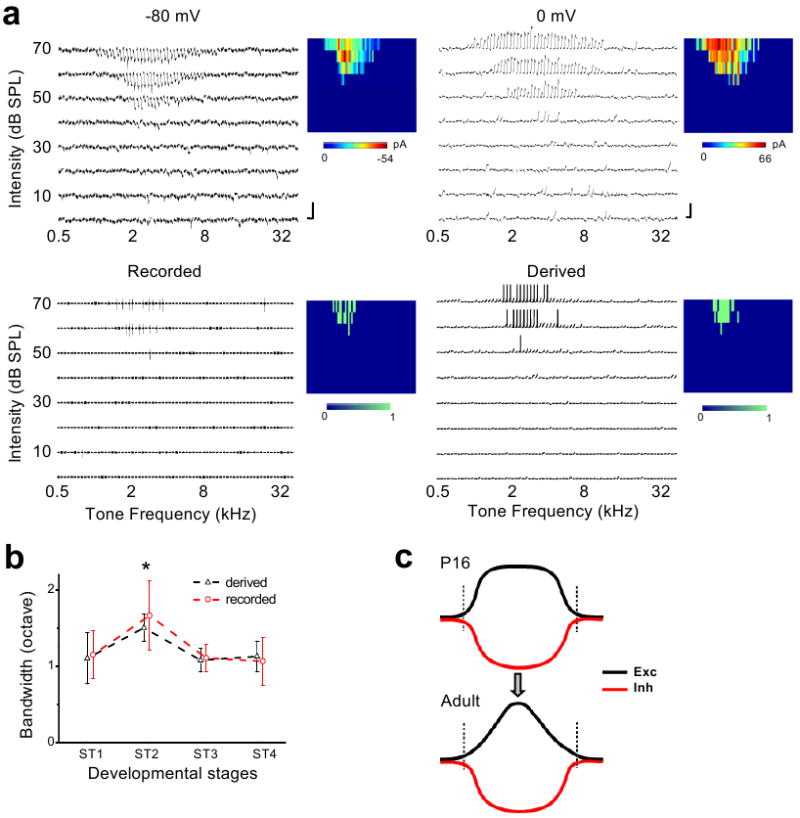
Functional receptive fields of neurons in sensory cortices undergo progressive refinement during development. Such refinement may be attributed to the pruning of non-optimal excitatory inputs, reshaping of the excitatory tuning profile through modifying the strengths of individual inputs, or strengthening of cortical inhibition. These models have not been directly tested because of the technical difficulties in assaying the spatiotemporal patterns of functional synaptic inputs during development. Here we apply in vivo whole-cell voltage-clamp recordings to the recipient layer 4 neurons in the rat primary auditory cortex (A1) to determine the developmental changes in the frequency-intensity tonal receptive fields (TRFs) of their excitatory and inhibitory inputs. Surprisingly, we observe co-tuned excitation and inhibition immediately after the onset of hearing, suggesting that a tripartite thalamocortical circuit with relatively strong feedforward inhibition is formed independently of auditory experience. The frequency ranges of tone-driven excitatory and inhibitory inputs first expand within a few days of the onset of hearing and then persist into adulthood. The latter phase is accompanied by a sharpening of the excitatory but not inhibitory frequency tuning profile, which results in relatively broader inhibitory tuning in adult A1 neurons. Thus the development of cortical synaptic TRFs after the onset of hearing is marked by a slight breakdown of previously formed excitation-inhibition balance. Our results suggest that functional refinement of cortical TRFs does not require a selective pruning of inputs, but may depend more on a fine adjustment of excitatory input strengths.


Figures

Figure 1
Figure 1. The synaptic TRFs shortly after the hearing onset
a, Three synaptic models for the functional refinement of sensory spike RFs (reduction in the size of RFs). Curves represent tuning profiles of excitation (black) and inhibition (red) along a sensory space. A pair of dotted vertical lines indicate the total responding range of excitatory inputs. I, pruning of peripheral excitatory inputs (i.e. reduced total responding range). II, adjustment of input strengths without pruning of inputs. III, broadening and strengthening of cortical inhibition. b, I-V curves for a recorded A1 neuron. Inset, average traces of synaptic currents (five repeats) of the neuron evoked by a noise stimulus. Average amplitude was measured within the 1–2ms (red) and 21–22ms (black) windows after the onset of the average synaptic response recorded at -80 mV. Correlation coefficient (r) is shown. c, TRFs of excitatory and inhibitory inputs for an example P13 neuron. Arrays of traces depict the excitatory (-80mV) and inhibitory (0mV) currents evoked by individual tone stimuli at various frequencies and intensities. Red arrow marks the intensity threshold. Color map depicts the peak amplitudes of tone-evoked synaptic currents within the TRF. The example excitatory (black) and inhibitory (red) responses evoked by the same tone (indicated by red dots) were enlarged. Dotted vertical lines mark the 75-ms window for plotting individual small traces in the array. d, Frequency tuning curves of excitatory (E) and inhibitory (I) inputs to the same cell as in b at two intensities: the threshold (70dB) and 20 dB above the threshold (90dB). The starting and ending responding frequencies for the inhibitory tuning were marked. Right, the tuning curves are normalized and superimposed (E, black, reversed in polarity). Blue line indicates the half-peak level. e, Mismatch indices at threshold intensity (grey) and intensity of 20dB above threshold (white). For two P12–14 cells exhibiting an intensity threshold of 80 dB SPL, MMI was derived at 10dB above the threshold. *: p < 0.005, paired t-test, n = 8, 6 for P12–14 and adult, respectively. Error bar = s.d.
Figure 2
Figure 2. Synaptic TRFs at later developmental stages
a-c, Synaptic TRFs of example neurons at P16 (a), P20 (b) and P80 (c) respectively. d, Frequency tuning curves of excitatory and inhibitory inputs at the intensity of 20dB above threshold for cells shown in a-c. Presentation is the same as in Fig. 1.
Figure 3
Figure 3. Developmental changes in spectral and temporal patterns of excitatory and inhibitory inputs
a, Average intensity threshold of excitatory, inhibitory and spike TRFs. ST1, P12-P14; ST2, P15-P18; ST3, P19-P25; ST4, ≥P80. *, significantly higher, p < 0.001, ANOVA with post hoc test, n = 10, 10, 10, 10 for excitatory, 8, 8, 5, 6 for inhibitory and 7, 11, 6, 14 for spike TRFs (by cell-attached recordings). b, Total frequency responding range (TFRR) of excitatory and inhibitory inputs at 10dB above intensity threshold. Data were from the same recordings as in a. Solid symbols are average values, and are connected with dotted lines for easier comparisons between neighbouring groups (the same for c,e, and f). *, significantly lower, p < 0.05, ANOVA with post hoc. c, Half-peak bandwidths (BW50%) of the tuning curves in b. *, difference in excitation; #, difference in inhibition; p < 0.001, ANOVA with post hoc. d, Mismatch indices at threshold intensity (grey) and 20dB above threshold (white) at different stages (n = 8, 8, 5, 6). For 20dB above threshold, ST2 is significantly lower than ST3 and ST4 (p < 0.05, ANOVA with post hoc). For each stage, MMI at threshold is significantly higher than at 20dB above threshold (p < 0.005, paired t-test). e, The average peak amplitudes of evoked inhibitory and excitatory currents from the same recordings as in a. The peak amplitude was determined by averaging five responses around the best frequency at the highest intensity tested. The I/E ratio was first calculated for individual cells with both excitatory and inhibitory TRFs recorded, and then averaged (circle, n = 8, 8, 5, 6, respectively). f, The onset latencies of synaptic responses, and the relative delay of inhibition. All error bars = s.d.
Figure 4
Figure 4. Synaptic mechanisms underlying the developmental refinement of spike TRFs in A1
a, An example cell with cell-attached recording followed by whole-cell recording. Top panels, the excitatory (-80mV) and inhibitory (0mV) TRFs of the cell. Scale: 50 pA and 100ms. Bottom left, the recorded spike TRF. Bottom right, the TRF of derived membrane potential and spike responses. Color maps represent the peak amplitudes of synaptic inputs (top), and number of spikes evoked (bottom). b, Bandwidths of spike TRFs derived and recorded from cells at different stages. Bandwidth was measured at 10dB above threshold. The value at ST2 is significantly higher (p = 0.1, 0.024, 0.014 between pairs of ST2-ST1, ST2-ST3 and ST2-ST4 respectively for recorded TRFs, n = 7, 11, 6, 14; p = 0.004, 0.016, 0.015 for derived TRFs, n = 8, 8, 5, 6, ANOVA with post hoc). Error bars = s.d. c, A developmental model. The excitatory (Exc) tuning profile is developmentally sharpened while the inhibitory (Inh) tuning remains relatively stable. Vertical lines mark the total range of inputs.

Comment in

  • Sensory systems: A balancing act.
    Bodo C. Bodo C. Nat Rev Neurosci. 2010 Aug;11(8):536-7. doi: 10.1038/nrn2885. Nat Rev Neurosci. 2010. PMID: 20672428 No abstract available.

References

    1. Katz LC, Shatz CJ. Synaptic activity and the construction of cortical circuits. Science. 1996;274:1133–8. - PubMed
    1. Fagiolini M, Pizzorusso T, Berardi N, Domenici L, Maffei L. Functional postnatal development of the rat primary visual cortex and the role of visual experience: dark rearing and monocular deprivation. Vision Res. 1994;34:709–20. - PubMed
    1. Zhang LI, Bao S, Merzenich MM. Persistent and specific influences of early acoustic environments on primary auditory cortex. Nat Neurosci. 2001;4:1123–30. - PubMed
    1. Inan M, Crair MC. Development of cortical maps: perspectives from the barrel cortex. Neuroscientist. 2007;13:49–61. - PubMed
    1. Hensch TK. Critical period plasticity in local cortical circuits. Nat Rev Neurosci. 2005;6:877–88. - PubMed

Publication types