

A decline in new HIV infections in South Africa: estimating HIV incidence from three national HIV surveys in 2002, 2005 and 2008
- PMID: 20559425
- PMCID: PMC2885415
- DOI: 10.1371/journal.pone.0011094
A decline in new HIV infections in South Africa: estimating HIV incidence from three national HIV surveys in 2002, 2005 and 2008
Abstract
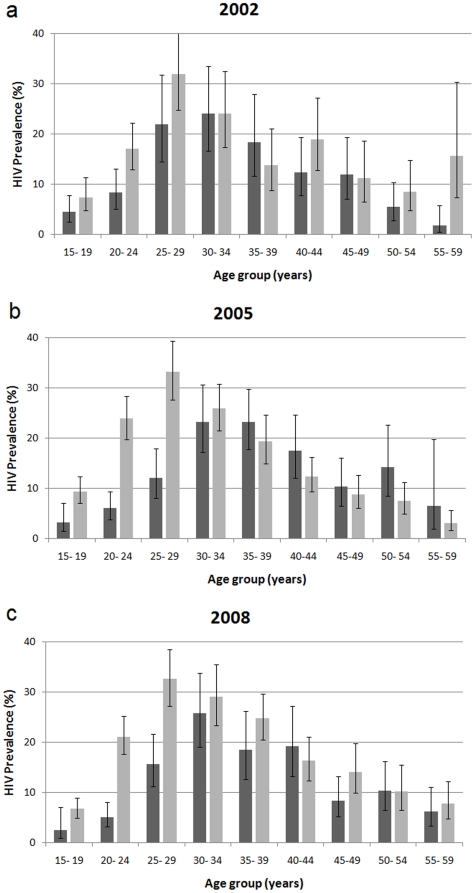
Background: Three national HIV household surveys were conducted in South Africa, in 2002, 2005 and 2008. A novelty of the 2008 survey was the addition of serological testing to ascertain antiretroviral treatment (ART) use.
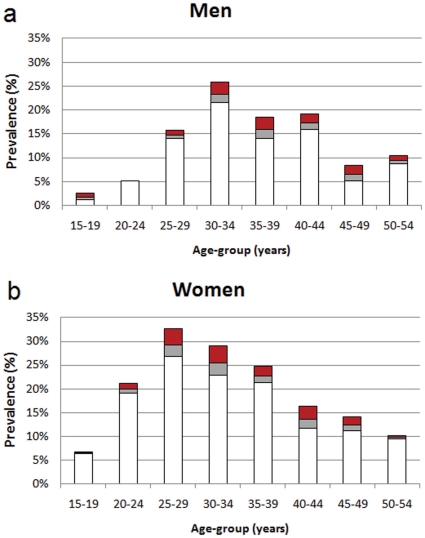
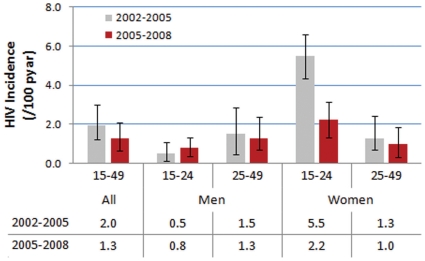
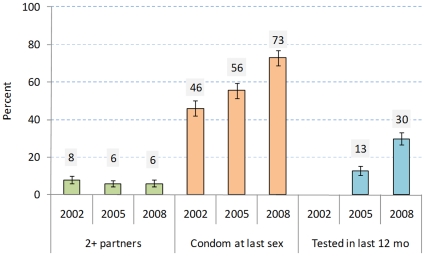
Methods and principal findings: We used a validated mathematical method to estimate the rate of new HIV infections (HIV incidence) in South Africa using nationally representative HIV prevalence data collected in 2002, 2005 and 2008. The observed HIV prevalence levels in 2008 were adjusted for the effect of antiretroviral treatment on survival. The estimated "excess" HIV prevalence due to ART in 2008 was highest among women 25 years and older and among men 30 years and older. In the period 2002-2005, the HIV incidence rate among men and women aged 15-49 years was estimated to be 2.0 new infections each year per 100 susceptible individuals (/100pyar) (uncertainty range: 1.2-3.0/100pyar). The highest incidence rate was among 15-24 year-old women, at 5.5/100pyar (4.5-6.5). In the period 2005-2008, incidence among men and women aged 15-49 was estimated to be 1.3/100 (0.6-2.5/100pyar), although the change from 2002-2005 was not statistically significant. However, the incidence rate among young women aged 15-24 declined by 60% in the same period, to 2.2/100pyar, and this change was statistically significant. There is evidence from the surveys of significant increases in condom use and awareness of HIV status, especially among youth.
Conclusions: Our analysis demonstrates how serial measures of HIV prevalence obtained in population-based surveys can be used to estimate national HIV incidence rates. We also show the need to determine the impact of ART on observed HIV prevalence levels. The estimation of HIV incidence and ART exposure is crucial to disentangle the concurrent impact of prevention and treatment programs on HIV prevalence.
Conflict of interest statement
Figures
References
-
- Department of Health (South Africa) National Antenatal Sentinel HIV & Syphilis Prevalence Survey in South Africa 2008. Pretoria, South Africa: Department of Health (South Africa); 2009.
-
- Department of Health (South Africa) National Strategic Plan for HIV and AIDS/Comprehensive HIV and AIDS Treatment Plan Statistics Memorandum. Pretoria, South Africa: Department of Health (South Africa); 2007.
Publication types
MeSH terms
Substances
Grants and funding
LinkOut - more resources
Full Text Sources
Medical
