

Altered retinoic acid metabolism in diabetic mouse kidney identified by O isotopic labeling and 2D mass spectrometry
- PMID: 20559430
- PMCID: PMC2885420
- DOI: 10.1371/journal.pone.0011095
Altered retinoic acid metabolism in diabetic mouse kidney identified by O isotopic labeling and 2D mass spectrometry
Abstract
Background: Numerous metabolic pathways have been implicated in diabetes-induced renal injury, yet few studies have utilized unbiased systems biology approaches for mapping the interconnectivity of diabetes-dysregulated proteins that are involved. We utilized a global, quantitative, differential proteomic approach to identify a novel retinoic acid hub in renal cortical protein networks dysregulated by type 2 diabetes.
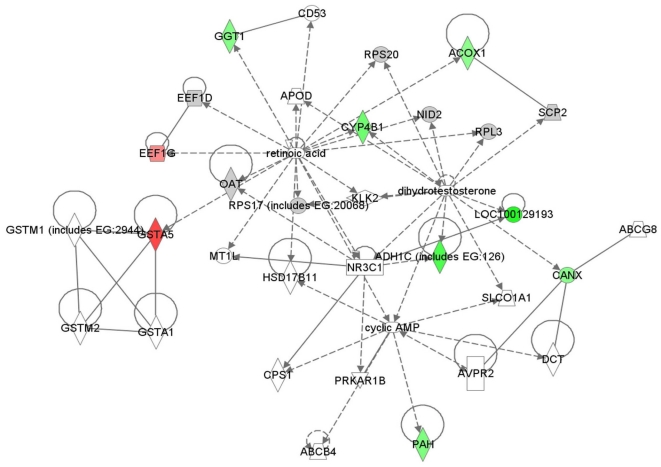
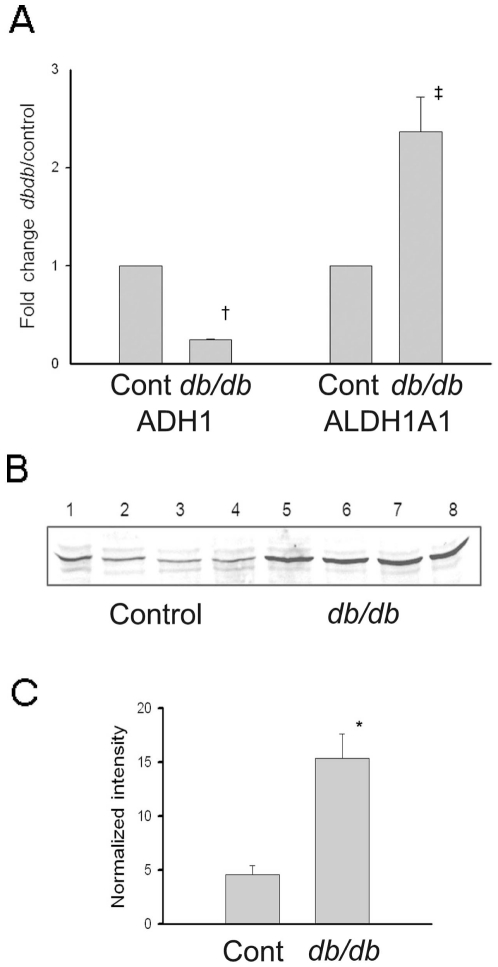
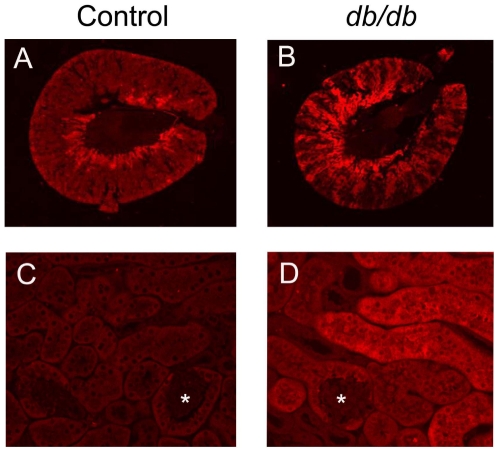
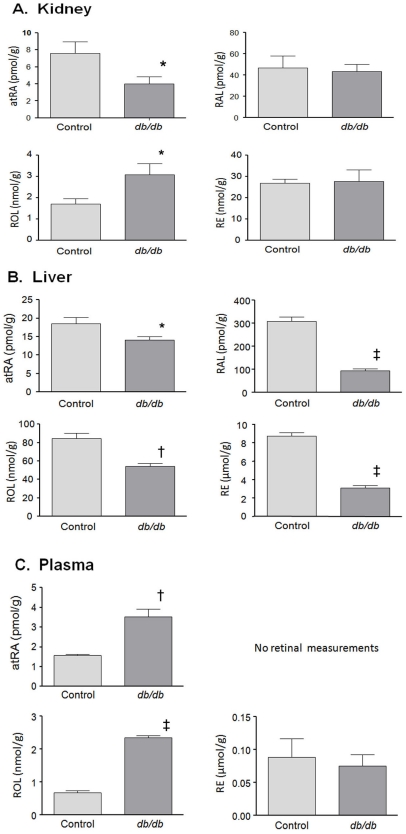
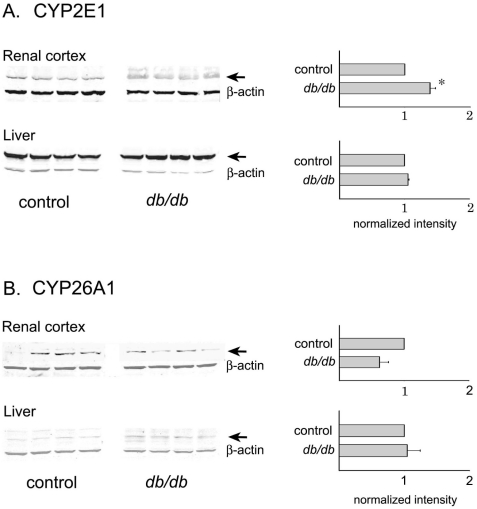
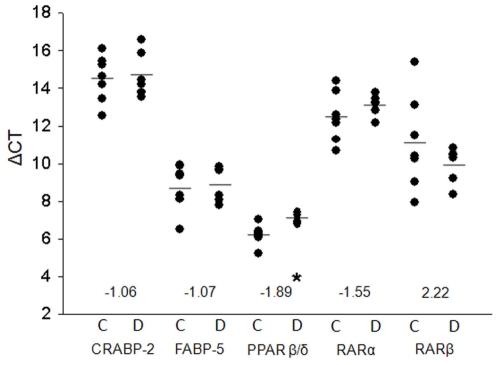
Methodology/principal findings: Total proteins were extracted from renal cortex of control and db/db mice at 20 weeks of age (after 12 weeks of hyperglycemia in the diabetic mice). Following trypsinization, (18)O- and (16)O-labeled control and diabetic peptides, respectively, were pooled and separated by two dimensional liquid chromatography (strong cation exchange creating 60 fractions further separated by nano-HPLC), followed by peptide identification and quantification using mass spectrometry. Proteomic analysis identified 53 proteins with fold change >or=1.5 and p<or=0.05 after Benjamini-Hochberg adjustment (out of 1,806 proteins identified), including alcohol dehydrogenase (ADH) and retinaldehyde dehydrogenase (RALDH1/ALDH1A1). Ingenuity Pathway Analysis identified altered retinoic acid as a key signaling hub that was altered in the diabetic renal cortical proteome. Western blotting and real-time PCR confirmed diabetes-induced upregulation of RALDH1, which was localized by immunofluorescence predominantly to the proximal tubule in the diabetic renal cortex, while PCR confirmed the downregulation of ADH identified with mass spectrometry. Despite increased renal cortical tissue levels of retinol and RALDH1 in db/db versus control mice, all-trans-retinoic acid was significantly decreased in association with a significant decrease in PPARbeta/delta mRNA.
Conclusions/significance: Our results indicate that retinoic acid metabolism is significantly dysregulated in diabetic kidneys, and suggest that a shift in all-trans-retinoic acid metabolism is a novel feature in type 2 diabetic renal disease. Our observations provide novel insights into potential links between altered lipid metabolism and other gene networks controlled by retinoic acid in the diabetic kidney, and demonstrate the utility of using systems biology to gain new insights into diabetic nephropathy.
Conflict of interest statement
Figures
Similar articles
-
Genetic evidence that retinaldehyde dehydrogenase Raldh1 (Aldh1a1) functions downstream of alcohol dehydrogenase Adh1 in metabolism of retinol to retinoic acid.J Biol Chem. 2003 Sep 19;278(38):36085-90. doi: 10.1074/jbc.M303709200. Epub 2003 Jul 7. J Biol Chem. 2003. PMID: 12851412
-
O-GlcNAcylation disrupts STRA6-retinol signals in kidneys of diabetes.Biochim Biophys Acta Gen Subj. 2019 Jun;1863(6):1059-1069. doi: 10.1016/j.bbagen.2019.03.014. Epub 2019 Mar 21. Biochim Biophys Acta Gen Subj. 2019. PMID: 30905621
-
Meprin-alpha in chronic diabetic nephropathy: interaction with the renin-angiotensin axis.Am J Physiol Renal Physiol. 2005 Oct;289(4):F911-21. doi: 10.1152/ajprenal.00037.2005. Epub 2005 Jun 7. Am J Physiol Renal Physiol. 2005. PMID: 15942051
-
Identification of endogenous retinoids, enzymes, binding proteins, and receptors during early postimplantation development in mouse: important role of retinal dehydrogenase type 2 in synthesis of all-trans-retinoic acid.Dev Biol. 2000 Apr 15;220(2):379-91. doi: 10.1006/dbio.2000.9634. Dev Biol. 2000. PMID: 10753524
-
Genetic dissection of retinoid dehydrogenases.Chem Biol Interact. 2001 Jan 30;130-132(1-3):469-80. doi: 10.1016/s0009-2797(00)00292-1. Chem Biol Interact. 2001. PMID: 11306068 Review.
Cited by
-
Nodes with high centrality in protein interaction networks are responsible for driving signaling pathways in diabetic nephropathy.PeerJ. 2015 Oct 1;3:e1284. doi: 10.7717/peerj.1284. eCollection 2015. PeerJ. 2015. PMID: 26557424 Free PMC article.
-
Liposoluble vitamins A and E in kidney disease.World J Nephrol. 2022 May 25;11(3):96-104. doi: 10.5527/wjn.v11.i3.96. World J Nephrol. 2022. PMID: 35733655 Free PMC article. Review.
-
Roles of Vitamin A Metabolism in the Development of Hepatic Insulin Resistance.ISRN Hepatol. 2013 Sep 30;2013:534972. doi: 10.1155/2013/534972. eCollection 2013. ISRN Hepatol. 2013. PMID: 27335827 Free PMC article. Review.
-
Serum Retinal and Retinoic Acid Predict the Development of Type 2 Diabetes Mellitus in Korean Subjects with Impaired Fasting Glucose from the KCPS-II Cohort.Metabolites. 2021 Aug 3;11(8):510. doi: 10.3390/metabo11080510. Metabolites. 2021. PMID: 34436451 Free PMC article.
-
Amelioration of Diabetic Nephropathy Using a Retinoic Acid Receptor β2 Agonist.J Pharmacol Exp Ther. 2018 Oct;367(1):82-94. doi: 10.1124/jpet.118.249375. Epub 2018 Jul 27. J Pharmacol Exp Ther. 2018. PMID: 30054312 Free PMC article.
References
-
- Ritz E, Rychlik I, Locatelli F, Halimi S. End-stage renal failure in type 2 diabetes: A medical catastrophe of worldwide dimensions. Am J Kidney Dis. 1999;34:795–808. - PubMed
-
- Oates PJ, Mylari BL. Aldose reductase inhibitors: therapeutic implications for diabetic complications. Expert Opin Investig Drugs. 1999;8:2095–2119. - PubMed
-
- Brownlee M, Cerami A, Vlassara H. Advanced products of nonenzymatic glycosylation and the pathogenesis of diabetic vascular disease. Diabetes Metab Rev. 1988;4:437–451. - PubMed
-
- Schmidt AM, Hori O, Cao R, Yan SD, Brett J, et al. RAGE: a novel cellular receptor for advanced glycation end products. Diabetes. 1996;45(Suppl 3):S77–S80. - PubMed
-
- Koya D, King GL. Protein kinase C activation and the development of diabetic complications. Diabetes. 1998;47:859–866. - PubMed
Publication types
MeSH terms
Substances
Grants and funding
LinkOut - more resources
Full Text Sources
Miscellaneous
