. 2010 Jun 14;5(6):e11110.
doi: 10.1371/journal.pone.0011110.

Plasmacytoid dendritic cells accumulate and secrete interferon alpha in lymph nodes of HIV-1 patients

Affiliations

Plasmacytoid dendritic cells accumulate and secrete interferon alpha in lymph nodes of HIV-1 patients

Clara Lehmann et al. PLoS One. .

Abstract

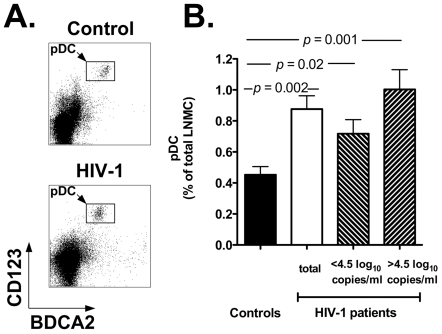
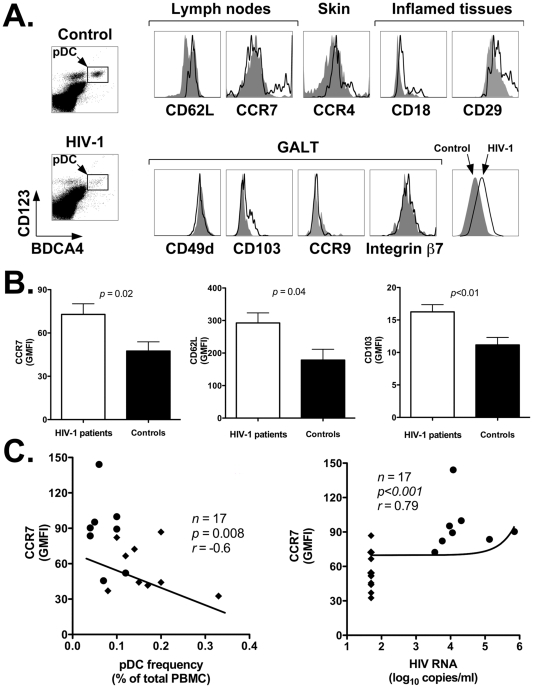
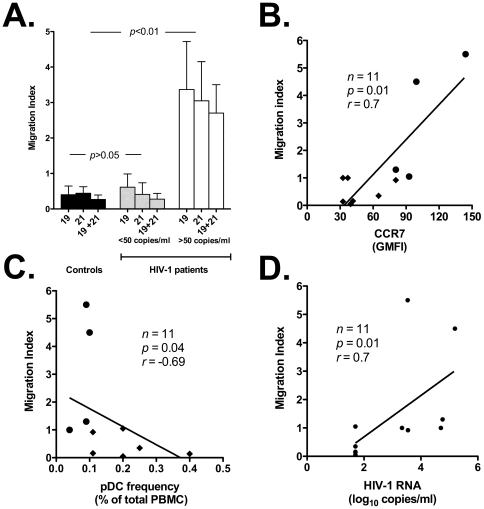
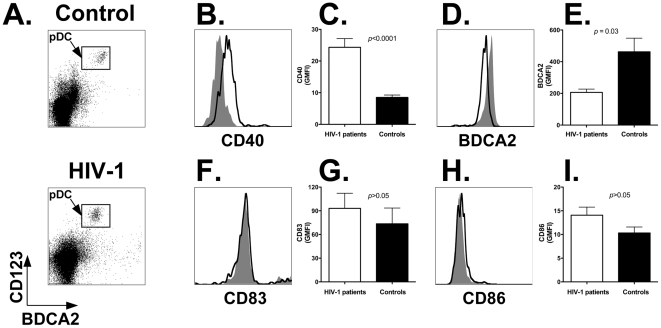
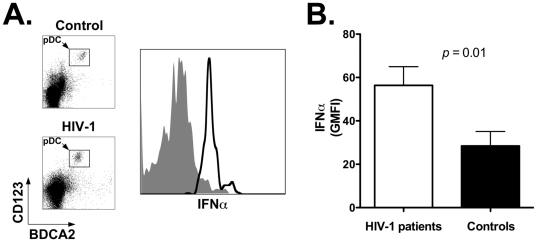
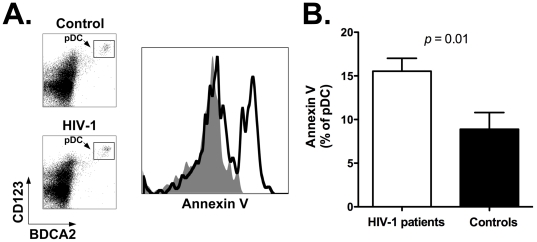
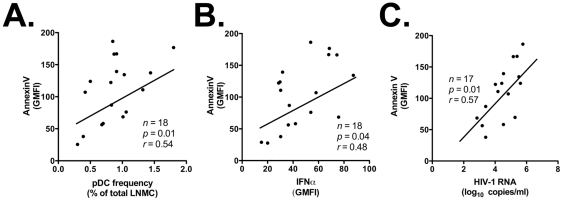
Circulating plasmacytoid dendritic cells (pDC) decline during HIV-1 infection, but at the same time they express markedly higher levels of interferon alpha (IFNalpha), which is associated with HIV-1 disease progression. Here we show an accumulation of pDC in lymph nodes (LN) of treatment-naïve HIV-1 patients. This phenomenon was associated with elevated expression of the LN homing marker, CCR7, on pDC in peripheral blood of HIV-1 patients, which conferred increased migratory capacity in response to CCR7 ligands in ex vivo functional assays. LN-homed pDC of HIV-1 patients presented higher CD40 and lower BDCA2 levels, but unchanged CD83 and CD86 expression. In addition, these cells expressed markedly higher amounts of IFNalpha compared to uninfected individuals, and were undergoing faster rates of cell death. These results demonstrate for the first time that in asymptomatic, untreated HIV-1 patients circulating pDC up-regulate CCR7 expression, accumulate in lymph nodes, and express high amounts of IFNalpha before undergoing cell death. Since IFNalpha inhibits cell proliferation and modulates immune responses, chronically high levels of this cytokine in LN of HIV-1 patients may impair differentiation and immune function of bystander CD4(+) T cells, thus playing into the mechanisms of AIDS immunopathogenesis.


Conflict of interest statement

Competing Interests: The authors have declared that no competing interests exist.

Figures

Figure 1
Figure 1. Accumulation of pDC in lymph nodes of HIV-1 patients.
Panel A: flow cytometry plots showing the pDC population in lymph node mononuclear cells (LNMC) of a representative control individual (top) and HIV-1 patient (bottom). We identified pDC by staining whole LNMC with anti-BDCA2 and anti-CD123 antibodies (rectangles within density plots) and by gating onto the live cell population as assessed by forward and side light scatter profile (not shown). Panel B: summary results for the frequency of pDC in LNMC of healthy controls (black bar, n = 11) and HIV-1 patients (white bar: total patients, n = 18; downward diagonal bar: patients with <4.5 log10 copies/ml HIV-1 RNA, n = 9; upward diagonal bar: patients with >4.5 log10 copies/ml HIV-1 RNA, n = 9). The panel shows the Mean and SEM values of pDC frequencies for each study group.
Figure 2
Figure 2. Increased expression of lymphoid tissue homing markers on circulating pDC of HIV-1 positive versus negative individuals.
Panel A: representative flow cytometry plots showing expression of nine homing markers grouped by tissue specificity: CD62L and CCR7 (lymph nodes); CCR4 (skin); CD18 and CD29 (inflamed tissues); and CD49d, CD103, CCR9 and integrin β7 (GALT). Histogram plots were obtained by gating onto the live cell population as assessed by forward and side light scatter profile (not shown), and then onto the pDC population as identified by staining with anti-BDCA4 and anti-CD123 antibodies (rectangles within density plots). Top density plot and gray area histogram: healthy control; bottom density plot and black line histogram: HIV-1 patient. Panel B: summary results of CCR7, CD62L and CD103 expression on pDC of HIV-1 positive (n = 17) and negative individuals (n = 11). We assessed the Geometric Mean Fluorescence Intensity (GMFI) for each marker by flow cytometry (Materials and Methods). The panels show the Mean and SEM of the GMFI values determined for all individuals in the two study groups. Black bars: healthy controls; white bar: HIV-1 patients. Panel C: correlation analyses between CCR7 expression and frequency of pDC in PBMC of HIV-1 patients (left) and HIV-1 viremia (right). The line summarizing the data uses a linear model fitted on the logarithmic scale that expresses HIV-1 viremia. Closed circles (•): viremic patients; closed diamonds (⧫): aviremic patients.
Figure 3
Figure 3. Higher migratory potential of circulating pDC from HIV-1 positive versus negative individuals in response to CCR7 ligands (CCL19 and CCL21).
Panel A: migration index of circulating pDC in response to CCR7 ligands. Total PBMC were seeded in the upper chamber of a transwell plate, while medium containing CCL19 and CCL21 (alone and in combination) was placed in the lower chamber. Flow cytometry was used to score pDC found in the lower chamber in response to CCR7 ligands vs. medium alone. The figure shows Migration Indices (determined as described in Materials and Methods) for control individuals (black bars; n = 6) vs. aviremic HIV-1 patients (<50 copies/ml of HIV-1 RNA; gray bars; n = 5) vs. viremic patients (>50 copies/ml of HIV-1 RNA; white bars; n = 6). 19: treatment with CCL19; 21: treatment with CCL21; 19+21: treatment with CCL19 and CCL21. Panel B: direct correlation between Migration Index and CCR7 expression on pDC. Panel C: inverse correlation between Migration Index and pDC frequency in PBMC of HIV-1 patients. Panel D: direct correlation between Migration Index and HIV-1 viremia. Closed circles (•): viremic patients; closed diamonds (⧫): aviremic patients.
Figure 4
Figure 4. Activated but immature phenotype of lymph node-homed pDC from HIV-1 positive versus negative individuals.
Panel A: identification of pDC populations in LNMC of a representative control (top panel) and HIV-1 positive (bottom panel) individual. LNMC were stained with anti-BDCA2 and anti-CD123 antibodies; analyses were carried out by gating on the live cell population as determined by forward and side scatter light profiles. Panels B, D, F and H: flow cytometry plots showing expression levels of activation (CD40 and BDCA2) and maturation (CD83 and CD86) markers on lymph node-homed pDC from a representative HIV-1 patient and control individual. Histogram plots were obtained by gating onto the live cell population as assessed by forward and side light scatter profile (not shown), and then onto the pDC population as identified by staining with anti-BDCA2 and anti-CD123 antibodies (as shown in density plots). Gray area: healthy control; black line: HIV-1 patient. Panels C, E, G, and I: expression levels of CD40, BDCA2, CD83 and CD86 on lymph node-homed pDC of control individuals (black bars; n = 11) and HIV-1 patients (white bars; n = 18). We assessed the Geometric Mean Fluorescence Intensity (GMFI) values for each marker (Materials and Methods). Panels show the Mean and SEM of the GMFI values determined with cells from all individuals in the two study groups.
Figure 5
Figure 5. Increased IFNα expression by pDC in lymph nodes of HIV-1 patients.
Panel A: flow cytometry plot showing expression of IFNα by lymph node-homed pDC from a representative healthy control and an HIV-1 patient. Histogram plot was obtained by gating onto the live cell population as assessed by forward and side light scatter profile (not shown), and then onto the pDC population as identified by staining with anti-BDCA2 and anti-CD123 antibodies. Top density plot and gray area histogram: healthy control; bottom density plot and black line histogram: HIV-1 patient. Panel B: summary results for expression levels of IFNα by lymph node-homed pDC of healthy controls (black bar; n = 11) and HIV-1 patients (white bar; n = 18). We assessed the Geometric Mean Fluorescence Intensity (GMFI) value with cells from all individuals in the two study groups (Materials and Methods). Panel shows the Mean and SEM of the GMFI values.
Figure 6
Figure 6. Higher rates of cell death by pDC in lymph nodes of HIV-1 patients.
Panel A: flow cytometry plot showing Annexin V staining of lymph node-homed pDC from a representative HIV-1 patient and control individual. Histogram plots were obtained by gating onto the live cell population as assessed by forward and side light scatter profile (not shown), and then onto the pDC population as identified by staining with anti-BDCA2 and anti-CD123 antibodies. Top density plot and gray area histogram: healthy control; bottom density plot and black line histogram: HIV-1 patient. Panel B: summary results for expression levels of Annexin V by lymph node-homed pDC of healthy controls (black bar; n = 11) and HIV-1 patients (white bar; n = 18). We determined the percentage of Annexin V positive pDC from all individuals in the two study groups (Materials and Methods). Panel shows the Mean and SEM values of the percent Annexin V positive pDC.
Figure 7
Figure 7. Increased rates of pDC apoptosis correlate with pDC frequency, IFNα expression by LN-homed pDC, and HIV-1 viremia.
Panels A, B and C: direct correlation between intensity of Annexin V staining on LN-homed pDC of HIV-1 patients and their frequency in LNMC, their ability to express IFNα, and the HIV-1 viral load in peripheral blood, respectively.

Similar articles

Cited by

References

    1. Brenchley JM, Douek DC. HIV infection and the gastrointestinal immune system. Mucosal Immunol. 2008;1:23–30. - PMC - PubMed
    1. Fahey JL, Taylor JM, Detels R, Hofmann B, Melmed R, et al. The prognostic value of cellular and serologic markers in infection with human immunodeficiency virus type 1. N Engl J Med. 1990;322:166–172. - PubMed
    1. Giorgi JV, Liu Z, Hultin LE, Cumberland WG, Hennessey K, et al. Elevated levels of CD38+ CD8+ T cells in HIV infection add to the prognostic value of low CD4+ T cell levels: results of 6 years of follow-up. The Los Angeles Center, Multicenter AIDS Cohort Study. J Acquir Immune Defic Syndr. 1993;6:904–912. - PubMed
    1. Deeks SG, Kitchen CM, Liu L, Guo H, Gascon R, et al. Immune activation set point during early HIV infection predicts subsequent CD4+ T-cell changes independent of viral load. Blood. 2004;104:942–947. - PubMed
    1. Hunt PW, Brenchley J, Sinclair E, McCune JM, Roland M, et al. Relationship between T cell activation and CD4+ T cell count in HIV-seropositive individuals with undetectable plasma HIV RNA levels in the absence of therapy. J Infect Dis. 2008;197:126–133. - PMC - PubMed

Publication types