Review
. 2010 Apr 27;8(5):1482-517.
doi: 10.3390/md8051482.

Production of chitooligosaccharides and their potential applications in medicine

Affiliations
Review

Production of chitooligosaccharides and their potential applications in medicine

Berit B Aam et al. Mar Drugs. .

Abstract

Chitooligosaccharides (CHOS) are homo- or heterooligomers of N-acetylglucosamine and D-glucosamine. CHOS can be produced using chitin or chitosan as a starting material, using enzymatic conversions, chemical methods or combinations thereof. Production of well-defined CHOS-mixtures, or even pure CHOS, is of great interest since these oligosaccharides are thought to have several interesting bioactivities. Understanding the mechanisms underlying these bioactivities is of major importance. However, so far in-depth knowledge on the mode-of-action of CHOS is scarce, one major reason being that most published studies are done with badly characterized heterogeneous mixtures of CHOS. Production of CHOS that are well-defined in terms of length, degree of N-acetylation, and sequence is not straightforward. Here we provide an overview of techniques that may be used to produce and characterize reasonably well-defined CHOS fractions. We also present possible medical applications of CHOS, including tumor growth inhibition and inhibition of T(H)2-induced inflammation in asthma, as well as use as a bone-strengthener in osteoporosis, a vector for gene delivery, an antibacterial agent, an antifungal agent, an anti-malaria agent, or a hemostatic agent in wound-dressings. By using well-defined CHOS-mixtures it will become possible to obtain a better understanding of the mechanisms underlying these bioactivities.

Keywords: application; chitinase; chitooligosaccharide (CHOS); chitosan; chitosanase.


Figures

Figure 1
Figure 1
Structures of the enzymes discussed in detail in this review. Figure 1a and 1b show, respectively, ChiA and ChiB from Serratia marcescens. Figure 1c shows hevamine, a plant family 18 chitinase whose structure is thought to resemble the (unknown) structure of the catalytic domain of ChiC from Serratia marcescens. Figure 1d shows ChiG from Streptomyces coelicolor A3(2). Figure 1e shows CsnN174, a family 46 chitosanase from Streptomyces sp. N174, which, judged from sequence similarity, is highly similar to Csn88 from Streptomyces coelicolor A3(2). The side chains of the catalytic acid and of the catalytic base/nucleophile are shown.
Figure 2
Figure 2
Schematic drawing of subsites, chitin binding domains and proposed orientation of polymeric substrates in ChiA and ChiB. Fn3, Fibronectin type 3 domain (substrate-binding); CBM5, chitin binding module. Dotted lines indicate that the polymer substrates are much longer than shown in the figure. Reducing end sugars are shown in grey. Figure and legend are from Horn et al. [56], and is reproduced with permission from Wiley-Blackwell.
Figure 3
Figure 3
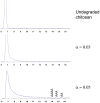
Degradation of chitosan (FA 0.65) by ChiA, ChiB and ChiC from Serratia marcescens. The pictures show chromatograms from size-exclusion chromatography. The peaks are marked by numbers which indicate the lengths (DP) of the oligomers they contain, or, in the case of peaks containing only one known compound, by the sequence of the oligomer. The annotation of the peaks is based on the use of standard samples, as well as NMR analyses. The α-values denote the degree of scission [full conversion of the chitosan to dimers only (DPn = 2) would give an α = 0.5 (α = 1/DPn)]. The lower panels represent the maximum obtainable α-values. Undegraded chitosan and fragments with a DP > 40 elute in the void volume of the column. The figure is from Horn et al. [56], and is reproduced with permission from Wiley-Blackwell. Additional product profiles at very low α for ChiA and ChiB that clearly reveal processivity have been published in Sikorski et al. [118].
Figure 4
Figure 4
Time course of the degradation of a chitosan with FA 0.65 by ChiB from Serratia marcescens. The graph shows the degree of scission (α) as a function of time; the biphasic kinetics is clearly visible. The slow phase continues until α reaches a value of about 0.37. Figure from Sørbotten et al. [64]. Reproduced with permission from Wiley-Blackwell.
Figure 5
Figure 5
Size-distribution of oligomers after extended hydrolysis of various chitosans with ChiB from Serratia marcescens. The pictures show chromatograms revealing the size-distribution of oligomers obtained upon extended hydrolysis of chitosans with FA of 0.65, 0.50, 0.32 and 0.13 to α-values (corresponding DPn-values in brackets) of 0.37 (2.7), 0.34 (2.9), 0.22 (4.5) and 0.11 (9.5), respectively. Figure from Sørbotten et al. [64]. Reproduced with permission from Wiley-Blackwell.
Figure 6
Figure 6
2D profiles showing the predicted outcome of chitosan hydrolysis with ChiB from Serratia marcescens. The X-axis shows the degree of scission, α, and the Y-axis shows the FA of the starting chitosan. The predicted amount of a particular product at specific α - FA combinations is indicated by color (the amounts of oligomers are expressed as % of the total mass of the polymer in the hydrolysis reaction and color coded as defined in the inserts). These profiles allow for selection of optimal reaction and substrate parameters for efficient production of oligomers with desired lengths. For example, high yields of octamer could be obtained if chitosan with FA 0.4 is hydrolyzed to α = 0.18 (the arrow indicates the maximum level of octamers). For example, for the octamer, at maximum yield conditions, approximately 8% of the polymer is expected to be converted to octamers. Figure taken from Sikorski et al. [114], and reproduced with permission from Wiley-Blackwell.
Figure 7
Figure 7
Size-distribution of oligomers emerging during hydrolysis of chitosan with FA 0.64 by ChiG from Streptomyces coelicolor A3(2). See legend to Figure 3 for further explanation. Figure from Heggset et al. [115]. Reproduced with permission from American Chemical Society.
Figure 7
Figure 7
Size-distribution of oligomers emerging during hydrolysis of chitosan with FA 0.64 by ChiG from Streptomyces coelicolor A3(2). See legend to Figure 3 for further explanation. Figure from Heggset et al. [115]. Reproduced with permission from American Chemical Society.
Figure 8
Figure 8
Size-distribution of oligomers after extended hydrolysis of various chitosans with ChiG from Streptomyces coelicolor A3(2). The chitosans with FA of 0.13, 0.32, 0.50, and 0.64 were degraded to maximum α-values of 0.04, 0.12, 0.23, and 0.33, respectively. Peaks are labeled as in Figure 3. Figure from Heggset et al. [115]. Reproduced with permission from American Chemical Society.

References

    1. Minke R, Blackwell J. The structure of alpha-chitin. J Mol Biol. 1978;120:167–181. - PubMed
    1. Gardner KH, Blackwell J. Refinement of structure of beta-chitin. Biopolymers. 1975;14:1581–1595. - PubMed
    1. Bhatnagar A, Sillanpää M. Applications of chitin- and chitosan-derivatives for the detoxification of water and wastewater - A short review. Adv Colloid Interface Sci. 2009;152:26–38. - PubMed
    1. Dodane V, Vilivalam VD. Pharmaceutical applications of chitosan. Pharm Sci Tech Today. 1998;1:246–253.
    1. Harish Prashanth KV, Tharanathan RN. Chitin/chitosan: modifications and their unlimited application potential -an overview. Trends Food Sci Technol. 2007;18:117–131.

MeSH terms

LinkOut - more resources