Review
. 2010 Apr 29;8(5):1567-636.
doi: 10.3390/md8051567.

Application of spectroscopic methods for structural analysis of chitin and chitosan

Affiliations
Review

Application of spectroscopic methods for structural analysis of chitin and chitosan

Jolanta Kumirska et al. Mar Drugs. .

Abstract

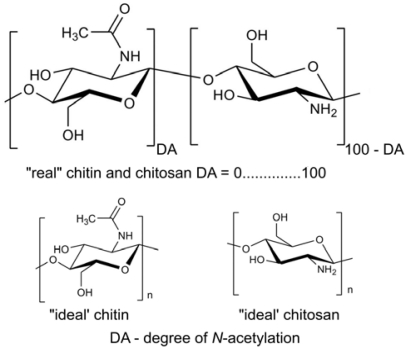
Chitin, the second most important natural polymer in the world, and its N-deacetylated derivative chitosan, have been identified as versatile biopolymers for a broad range of applications in medicine, agriculture and the food industry. Two of the main reasons for this are firstly the unique chemical, physicochemical and biological properties of chitin and chitosan, and secondly the unlimited supply of raw materials for their production. These polymers exhibit widely differing physicochemical properties depending on the chitin source and the conditions of chitosan production. The presence of reactive functional groups as well as the polysaccharide nature of these biopolymers enables them to undergo diverse chemical modifications. A complete chemical and physicochemical characterization of chitin, chitosan and their derivatives is not possible without using spectroscopic techniques. This review focuses on the application of spectroscopic methods for the structural analysis of these compounds.

Keywords: chemical modification; chitin; chitosan; physicochemical parameters; structural analysis using spectroscopic techniques.


Figures

Figure 1
Figure 1
The chemical structures of chitin and chitosan.
Figure 2
Figure 2
X-ray diffraction spectra of chitin and chitosan fibers. Reprinted from Carbohydrate Polymers 56, 2004, Muzzarelli, C., Francescangeli, O., Tosi, G., Muzzarelli, R.A.A., Susceptibility of dibutyryl chitin and regenerated chitin fibers to deacetylation and depolymerization by lipases, 137–146, Copyright (2010), with permission from Elsevier [56].
Figure 3
Figure 3
Modes of hydrogen bonding in α-chitin: (a) intrachain C(3′)OH···OC(5) bond; (b) intrachain C(6′1)OH···O=C(71) bond; (c) interchain C(6′1)O···HOC(62) bond; (d) interchain C(21)NH···O=C(73) bond. Adapted with permission from Biomacromolecules. 2000, 1, 609–614. Copyright 2010, American Chemical Society [18].
Figure 4
Figure 4
Modes of hydrogen bonding in β-chitin: (a) intrachain C(3′)OH···OC(5) bond; (b) interchain C(21)NH···O=C(73) bond and C(6′1)OH···O=C(73) bond (ac plane projection); (c) interchain C(21)NH···O=C(73) bond (ab plane projection). Adapted with permission from Biomacromolecules. 2000, 1, 609–614. Copyright 2010, American Chemical Society [18].
Figure 5
Figure 5
Comparison of X-ray powder diffractograms of chitin and chitosan with different degrees of N-acetylation. Figures 0–6 imply different DA (%): 0-83.1, 1-40.6, 2-36.5, 3-41.3, 4-28.6, 5-13.0, 6-7.2. Reprinted from Carbohydrate Research 340, 2005, Zhang, Y., Xue, C., Xue, Y., Gao, R., Zhang, X., Determination of the degree of deacetylation of chitin and chitosan by X-ray powder diffraction, 1914–1917, Copyright (2010), with permission from Elsevier [74].
Figure 6
Figure 6
FTIR spectra of β-chitin from T. rotula, α-chitin from crabs and I. basta chitin after NaOH and H2O2 treatment. Dashed vertical lines are drawn to mark characteristic differences between α- and β-chitin. Reprinted from Journal of Structural Biology 168, 2009, Brunner, E., Ehrlich, H., Schupp, P., Hedrich, R., Hunoldt, S., Kammer, M., Machill, S., Paasch, S., Bazhenov, V.V., Kurek, D.V., Arnold, T., Brockmann, S., Ruhnov, M., Born, R., Chitin-based scaffolds are an integral part of the skeleton of the marine demosponge lanthella basta, 539–547, Copyright (2010), with permission from Elsevier [110].
Figure 7
Figure 7
FTIR of chitin (A) and chitosan (B) produced from silkworm pupae; range: 1400–1700 cm−1. Reprinted from Carbohydrate Polymers 64, 2006, Paulino, A.T., Simionato, J.I., Garcia, J.C., Nozaki J., Characterization of chitosan and chitin produced from silkworm crysalides, 98–103, Copyright (2010), with permission from Elsevier [114].
Figure 8
Figure 8
IR spectrum of chitin. Representation of the different baselines mentioned in the literature. Reprinted from Polymer 42, 2001, Brugnerotto, J., Lizardi, J., Goycoolea, F.M., Argüelles-Monal, W., Desbrières, J., Rinaudo, M., An infrared investigation in relation with chitin and chitosan characterization, 3569–3580, Copyright (2010), with permission from Elsevier [129].
Figure 9
Figure 9
Comparison of IR spectra (shown as absorbance) of α- and β-chitin recorded using different sampling techniques. For α-chitin: (a) ATR on film, (b) DRIFT on powder, (c) Standard transmission on film, (d) Standard transmission on KBr pellet. For β-chitin: (e) Standard transmission on KBr pellets. Reprinted from Polymer 42, 2001, Brugnerotto, J., Lizardi, J., Goycoolea, F.M., Argüelles-Monal, W., Desbrières, J., Rinaudo, M., An infrared investigation in relation with chitin and chitosan characterization, 3569–3580, Copyright (2010), with permission from Elsevier [129].
Figure 10
Figure 10
FTIR spectra of (A) chitosan (C), (B) l-glutamic acid (l-GA), and(C) chitosan- l-glutamic acid derivative (Cl-GA). Reprinted from Carbohydrate Polymers 76, 2009, Singh, J., Dutta, P.K., Dutta, J., Hunt, A.J., Macquarrie, D.J., Clark, J.H., Preparation and properties of highly soluble chitosan-l-glutamic acid aerogel derivative, 188–195, Copyright (2010), with permission from Elsevier [144].
Figure 11
Figure 11
UV spectra: (a) a mixture of N-acetyl-glucosamine and glucosamine hydrochloride in 0.1 M hydrochloric acid solution; (b) chitosan in 0.1 M hydrochloric acid solution. Reprinted from Carbohydrate Research 341, 2006, Liu, D., Wei, Y., Yao, P., Jiang, L., Determination of the degree of acetylation of chitosan by UV spectrometry using dual standards, 782–785, Copyright (2010), with permission from Elsevier [180].
Figure 12
Figure 12
UV–Vis spectrum of a pure chitosan (ch) film measured in transmission mode, and diffuse reflectance UV–Vis spectra of untreated cellulose (cel), and cellulose treated with 1% chitosan (ch–cel). Reprinted from European Polymer Journal 42, 2006, Urreaga, J.M., de la Orden, M.U., Chemical interactions and yellowing in chitosan-treated cellulose, 2606–2616, Copyright (2010), with permission from Elsevier [107].
Figure 13
Figure 13
MALDI-TOF MS of deacetylated chitooligosaccharides obtained from ultrasonically treated chitosan. Reprinted with permission from Biomacromolecules. 2009, 10, 1203–1211. Copyright 2010, American Chemical Society [226].
Figure 14
Figure 14
Mass spectra of acid hydrolyzed chitin from P. chrysogenum growing on (A) minimal medium, (B) medium with the addition of (15NH4)2SO4 (rich medium–Blakeslee’s formula). Reprinted with permission from Biomacromolecules. 2009, 10, 793–797. Copyright 2010, American Chemical Society [245].
Figure 15
Figure 15
MALDI-TOF MS of chitooligosaccharides with different degrees of acetylation. Reprinted with permission from Biomacromolecules. 2008, 9, 1731–1738. Copyright 2010, American Chemical Society [240].
Figure 16
Figure 16
MALDI-TOF-MS of AMAC derivatized chitooligosaccharides: (A) DP 5, (B) DP 6, (C) DP 8. Reprinted from Carbohydrate Polymers 74, 2008, Cederkvist, F.H., Parmer, M.P., Vårum, K.M., Eijsink, V.G.H., Sørlie, M., Inhibition of a family 18 chitinase by chitooligosacharides, 41–49, Copyright (2010), with permission from Elsevier [229].
Figure 17
Figure 17
MALDI-TOF/TOF-MS/MS of AMAC derivatized D3A5 sugar 1711.80 m/z (▴ - AMAC). Reprinted from Carbohydrate Polymers 74, 2008, Cederkvist, F.H., Parmer, M.P., Vårum, K.M., Eijsink, V.G.H., Sørlie, M., Inhibition of a family 18 chitinase by chitooligosacharides, 41–49, Copyright (2010), with permission from Elsevier [229].
Figure 18
Figure 18
1H NMR spectrum of chitosan; the DA = 48. Spectrum was recorded at 400 MHz and 80 °C in D2O (pD ~ 5) relative to internal acetone (δH 2.225).
Figure 19
Figure 19
Liquid-state 13C NMR spectrum of chitosan; DA = 48. Spectrum was recorded at 100 MHz and 70 °C in D2O (pD ~ 5) relative to internal acetone (δC 31.45).
Figure 20
Figure 20
13C CP-MAS NMR spectra of samples A-D (with decreasing DA; ~100%, ~60%, ~20%, ~0%). Reprinted with permission from Biomacromolecules. 2008, 1, 746–751. Copyright 2010, American Chemical Society [280].
Figure 21
Figure 21
15N CP-MAS NMR spectra of samples A-D (with decreasing DA; ~100%, ~60%, ~20%, ~0%). Reprinted with permission from Biomacromol. 2000, 4, 746–751. Copyright 2010, ACS Publications [280].
Figure 22
Figure 22
Section of the anomeric region of the 1H NMR spectrum of chitosan; DA = 48. Spectrum was recorded at 400 MHz and 80 °C in D2O (pD ~ 5) relative to internal acetone (δH 2.225). Appropriate intensities of sequences are labeled.
Figure 23
Figure 23
Sections of the 13C NMR spectra of chitosan; DA = 48, showing the C-5 signals region. Spectrum was recorded at 100 MHz and 70 °C in D2O (pD ~ 5) relative to internal acetone (δC 31.45). Appropriate sequences are labeled.
Figure 24
Figure 24
The distribution of GlcNAc (▪) and GlcN (●) residues along the polysaccharide chain at DA = 0.5; (a)–perfect block (PA = 0), (b)–random distribution (PA = 1), and (c)–alternating distribution (PA = 2).
Figure 25
Figure 25
1H NMR spectra of chitosan (DP = 25, DA < 0.001) N-alkylated with the N-acetylated trimer A–A–M. Reprinted from Carbohydrate Research 337, 2002, Tømmeraas, K., Köping-Höggård, M., Vårum, K.M., Christensen B.E., Artursson, P., Smidsrød, O., Preparation and characterization of chitosans with oligosacharide branches, 2455–2462, Copyright (2010), with permission from Elsevier [303].

Similar articles

Cited by

References

    1. Muzzarelli RAA, Jeuniaux C, Gooday GW. Chitin in Nature and Technology. Plenum Publishing Corporation; New York, NY, USA: 1986.
    1. Rinaudo M. Chitin and chitosan: Properties and application. Prog Polym Sci. 2006;31:603–632.
    1. Roberts GAF. Chitin Chemistry. 1st ed. MacMillan; London, UK: 1992.
    1. Austin PR. Chitin solutions and purification of chitin. Methods Enzymol. 1988;161:403–407.
    1. Kurita K. Controlled functionalization of the polysaccharide chitin. Progr Polym Sci. 2001;26:1921–1971.

Publication types

MeSH terms

LinkOut - more resources