

Membrane potential modulation of ionomycin-stimulated Ca(2+) entry via Ca (2+)/H (+) exchange and SOC in rat submandibular acinar cells
- PMID: 20560052
- PMCID: PMC10717405
- DOI: 10.1007/s12576-010-0098-7
Membrane potential modulation of ionomycin-stimulated Ca(2+) entry via Ca (2+)/H (+) exchange and SOC in rat submandibular acinar cells
Abstract
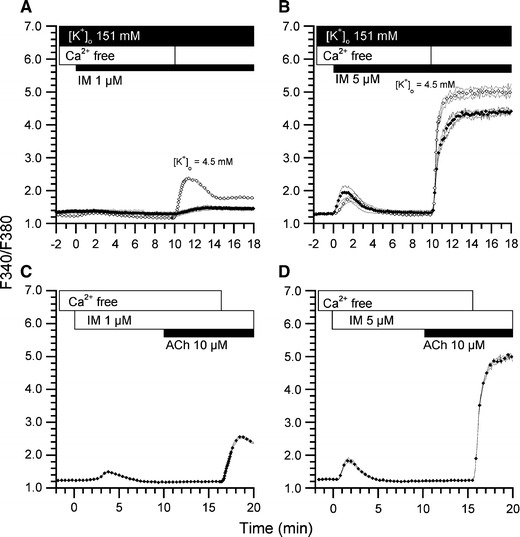
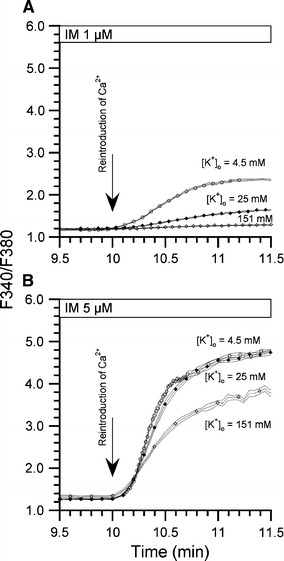
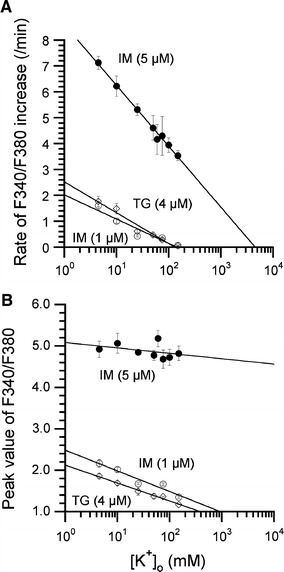
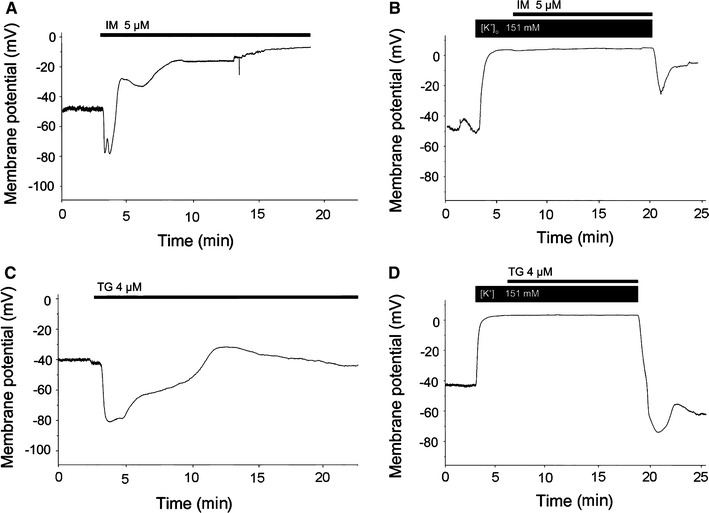
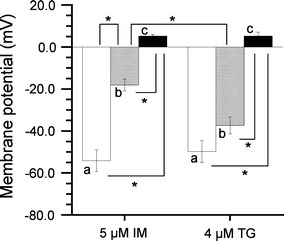
Ionomycin (IM) at 5 microM mediates the Ca(2+)/H(+) exchange, while IM at 1 microM activates the store-operated Ca(2+) entry channels (SOCs). In this study, the effects of depolarization on both pathways were examined in rat submandibular acinar cells by increasing extracellular K(+) concentration ([K(+)](o)). IM (5 microM, the Ca(2+)/H(+) exchange) increased the intracellular Ca(2+) concentration ([Ca(2+)](i)) to an extremely high value at 151 mM [K(+)](o). However, with increasing [K(+)](o), the rates of Ca(2+) entry decreased in a linear relationship. The reversal potential (E (rev)) for the Ca(2+)/H(+) exchange was +93 mV, suggesting that IM (5 microM) exchanges 1 Ca(2+) for 1 H(+). Thus, depolarization decreases the Ca(2+) influx via the Ca(2+)/H(+) exchange because of its electrogenicity (1 Ca(2+) for 1 H(+)). On the other hand, IM (1 microM, the SOCs) abolished an increase in [Ca(2+)](i) at 151 mM [K(+)](o). With increasing [K(+)](o), the rate of Ca(2+) entry immediately decreased linearly. The E (rev) for the SOC was +3.7 mV, suggesting that the SOCs are nonselective cation channels and less selective for Ca(2+) over Na(+) (P (Ca)/P (Na) = 8.2). Moreover, an increase in extracellular Ca(2+) concentration (20 mM) enhanced the Ca(2+) entry via the SOCs at 151 mM [K(+)](o), suggesting depolarization does not inhibit the SOCs and decreases the driving force for the Ca(2+) entry. This suggests that membrane potential changes induced by a secretory stimulation finely regulate the [Ca(2+)](i) via the SOCs in rat submandibular acinar cells. In conclusion, IM increases [Ca(2+)](i) via two pathways depending on its concentration, the exchange of 1 Ca(2+) for 1 H(+) at 5 muM and the SOCs at 1 microM.
Figures


Similar articles
-
[Ca2+]i oscillations induced by high [K+]o in acetylcholine-stimulated rat submandibular acinar cells: regulation by depolarization, cAMP and pertussis toxin.Exp Physiol. 2003 May;88(3):369-79. doi: 10.1113/eph8802566. Exp Physiol. 2003. PMID: 12719761
-
HCO(3) (-)-dependent transient acidification induced by ionomycin in rat submandibular acinar cells.J Physiol Sci. 2010 Jul;60(4):273-82. doi: 10.1007/s12576-010-0095-x. Epub 2010 May 22. J Physiol Sci. 2010. PMID: 20495897 Free PMC article.
-
Inhibition of depolarization-induced [3H]noradrenaline release from SH-SY5Y human neuroblastoma cells by some second-generation H(1) receptor antagonists through blockade of store-operated Ca(2+) channels (SOCs).Biochem Pharmacol. 2001 Nov 1;62(9):1229-38. doi: 10.1016/s0006-2952(01)00754-7. Biochem Pharmacol. 2001. PMID: 11705456
-
Distinct Ca(2+)-permeable cation currents are activated by internal Ca(2+)-store depletion in RBL-2H3 cells and human salivary gland cells, HSG and HSY.J Membr Biol. 2004 Jul 15;200(2):93-104. doi: 10.1007/s00232-004-0698-3. J Membr Biol. 2004. PMID: 15520907
-
Extracellular ATP activates different signalling pathways in rat Sertoli cells.Biochem J. 1995 Oct 1;311 ( Pt 1)(Pt 1):269-74. doi: 10.1042/bj3110269. Biochem J. 1995. PMID: 7575464 Free PMC article.
Cited by
-
Control of PTH secretion by the TRPC1 ion channel.JCI Insight. 2020 Apr 23;5(8):e132496. doi: 10.1172/jci.insight.132496. JCI Insight. 2020. PMID: 32213715 Free PMC article.
-
Monitoring correlates of SARS-CoV-2 infection in cell culture using a two-photon-active calcium-sensitive dye.Cell Mol Biol Lett. 2024 Jul 19;29(1):105. doi: 10.1186/s11658-024-00619-0. Cell Mol Biol Lett. 2024. PMID: 39030477 Free PMC article.
-
Functional Potassium Channels in Macrophages.J Membr Biol. 2023 Apr;256(2):175-187. doi: 10.1007/s00232-022-00276-4. Epub 2023 Jan 9. J Membr Biol. 2023. PMID: 36622407 Review.
References
-
- Pfeiffer DR, Taylor RW, Lardy HA. Ionophore A23187: cation binding and transport properties. Ann N Y Acad Sci. 1978;307:402–423. doi: 10.1111/j.1749-6632.1978.tb41965.x. - DOI
-
- Fasolato C, Pozzan T. Effect of membrane potential on divalent cation transport catalyzed by the “electroneutral” ionophores A23187 and ionomycin. J Biol Chem. 1989;264:19630–19636. - PubMed
MeSH terms
Substances
LinkOut - more resources
Full Text Sources
Medical
Miscellaneous
