

Abraham's children in the genome era: major Jewish diaspora populations comprise distinct genetic clusters with shared Middle Eastern Ancestry
- PMID: 20560205
- PMCID: PMC3032072
- DOI: 10.1016/j.ajhg.2010.04.015
Abraham's children in the genome era: major Jewish diaspora populations comprise distinct genetic clusters with shared Middle Eastern Ancestry
Abstract
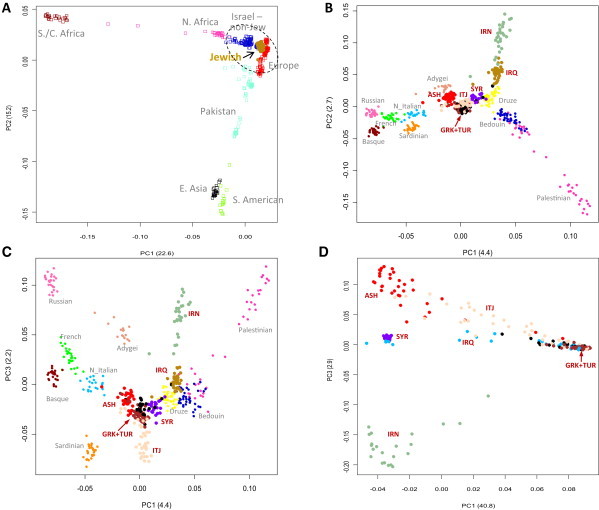
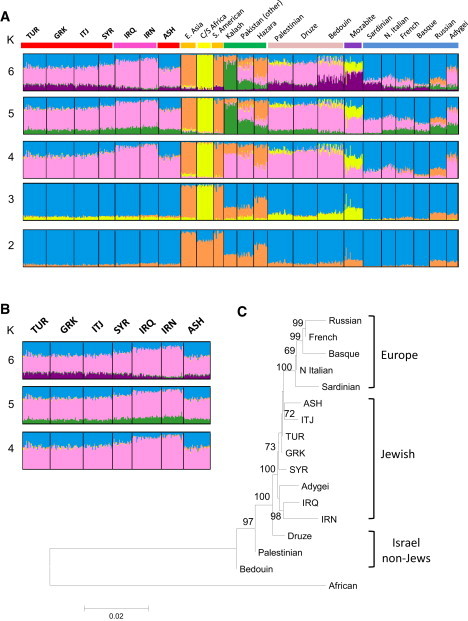
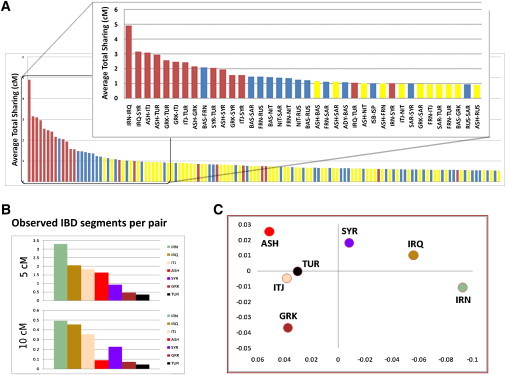
For more than a century, Jews and non-Jews alike have tried to define the relatedness of contemporary Jewish people. Previous genetic studies of blood group and serum markers suggested that Jewish groups had Middle Eastern origin with greater genetic similarity between paired Jewish populations. However, these and successor studies of monoallelic Y chromosomal and mitochondrial genetic markers did not resolve the issues of within and between-group Jewish genetic identity. Here, genome-wide analysis of seven Jewish groups (Iranian, Iraqi, Syrian, Italian, Turkish, Greek, and Ashkenazi) and comparison with non-Jewish groups demonstrated distinctive Jewish population clusters, each with shared Middle Eastern ancestry, proximity to contemporary Middle Eastern populations, and variable degrees of European and North African admixture. Two major groups were identified by principal component, phylogenetic, and identity by descent (IBD) analysis: Middle Eastern Jews and European/Syrian Jews. The IBD segment sharing and the proximity of European Jews to each other and to southern European populations suggested similar origins for European Jewry and refuted large-scale genetic contributions of Central and Eastern European and Slavic populations to the formation of Ashkenazi Jewry. Rapid decay of IBD in Ashkenazi Jewish genomes was consistent with a severe bottleneck followed by large expansion, such as occurred with the so-called demographic miracle of population expansion from 50,000 people at the beginning of the 15th century to 5,000,000 people at the beginning of the 19th century. Thus, this study demonstrates that European/Syrian and Middle Eastern Jews represent a series of geographical isolates or clusters woven together by shared IBD genetic threads.
Figures
Similar articles
-
North African Jewish and non-Jewish populations form distinctive, orthogonal clusters.Proc Natl Acad Sci U S A. 2012 Aug 21;109(34):13865-70. doi: 10.1073/pnas.1204840109. Epub 2012 Aug 6. Proc Natl Acad Sci U S A. 2012. PMID: 22869716 Free PMC article.
-
No evidence from genome-wide data of a Khazar origin for the Ashkenazi Jews.Hum Biol. 2013 Dec;85(6):859-900. doi: 10.3378/027.085.0604. Hum Biol. 2013. PMID: 25079123
-
Genomic microsatellites identify shared Jewish ancestry intermediate between Middle Eastern and European populations.BMC Genet. 2009 Dec 8;10:80. doi: 10.1186/1471-2156-10-80. BMC Genet. 2009. PMID: 19995433 Free PMC article.
-
The population genetics of the Jewish people.Hum Genet. 2013 Feb;132(2):119-27. doi: 10.1007/s00439-012-1235-6. Epub 2012 Oct 10. Hum Genet. 2013. PMID: 23052947 Free PMC article. Review.
-
Cystic fibrosis in Jews: frequency and mutation distribution.Genet Test. 1997;1(1):35-9. doi: 10.1089/gte.1997.1.35. Genet Test. 1997. PMID: 10464623 Review.
Cited by
-
The Effect of Consanguinity on Between-Individual Identity-by-Descent Sharing.Genetics. 2019 May;212(1):305-316. doi: 10.1534/genetics.119.302136. Epub 2019 Mar 29. Genetics. 2019. PMID: 30926583 Free PMC article.
-
The history of African gene flow into Southern Europeans, Levantines, and Jews.PLoS Genet. 2011 Apr;7(4):e1001373. doi: 10.1371/journal.pgen.1001373. Epub 2011 Apr 21. PLoS Genet. 2011. PMID: 21533020 Free PMC article.
-
Characteristics of neutral and deleterious protein-coding variation among individuals and populations.Am J Hum Genet. 2014 Oct 2;95(4):421-36. doi: 10.1016/j.ajhg.2014.09.006. Am J Hum Genet. 2014. PMID: 25279984 Free PMC article.
-
The Genetics of Bene Israel from India Reveals Both Substantial Jewish and Indian Ancestry.PLoS One. 2016 Mar 24;11(3):e0152056. doi: 10.1371/journal.pone.0152056. eCollection 2016. PLoS One. 2016. PMID: 27010569 Free PMC article.
-
Live birth sex ratios and father's geographic origins in Jerusalem, 1964-1976.Am J Hum Biol. 2017 May 6;29(3):10.1002/ajhb.22945. doi: 10.1002/ajhb.22945. Epub 2016 Nov 30. Am J Hum Biol. 2017. PMID: 27901293 Free PMC article.
References
-
- Biran A., Naveh J. An Aramaic stele fragment from Tel Dan. Isr. Explor. J. 1993;43:81–98.
-
- Ben-Sasson H.H. Harvard University Press; Cambridge: 1976. A History of the Jewish People.
-
- Levy H. Mazda Publishers; Costa Mesa, CA: 1999. Comprehensive History of the Jews of Iran.
-
- Rejwan N. Westview Press; Boulder: 1985. The Jews of Iraq: 3000 Years of History and Culture.
-
- Baron S.W. Columbia University Press; New York: 1937. Social and Religious History of the Jews.
Publication types
MeSH terms
Grants and funding
LinkOut - more resources
Full Text Sources
Other Literature Sources