

Reproducibility of direct quantitative measures of cortical bone microarchitecture of the distal radius and tibia by HR-pQCT
- PMID: 20561906
- PMCID: PMC2926164
- DOI: 10.1016/j.bone.2010.05.034
Reproducibility of direct quantitative measures of cortical bone microarchitecture of the distal radius and tibia by HR-pQCT
Abstract
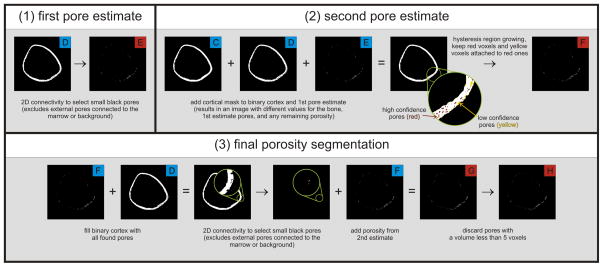
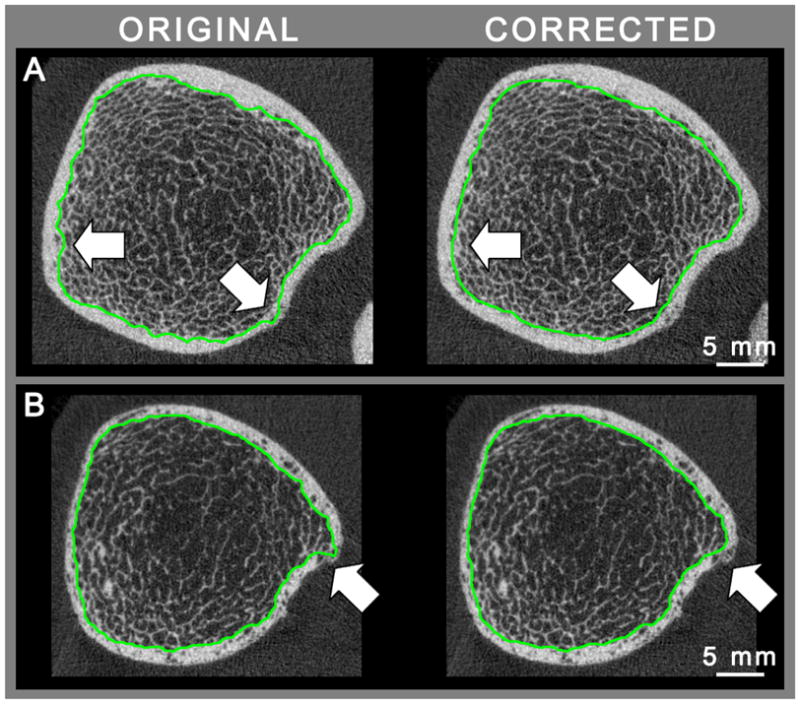
Quantitative cortical microarchitectural end points are important for understanding structure-function relations in the context of fracture risk and therapeutic efficacy. This technique study details new image-processing methods to automatically segment and directly quantify cortical density, geometry, and microarchitecture from HR-pQCT images of the distal radius and tibia. An automated segmentation technique was developed to identify the periosteal and endosteal margins of the distal radius and tibia and detect intracortical pore space morphologically consistent with Haversian canals. The reproducibility of direct quantitative cortical bone indices based on this method was assessed in a pooled data set of 56 subjects with two repeat acquisitions for each site. The in vivo precision error was characterized using root mean square coefficient of variation (RMSCV%) from which the least significant change (LSC) was calculated. Bland-Altman plots were used to characterize bias in the precision estimates. The reproducibility of cortical density and cross-sectional area measures was high (RMSCV <1% and <1.5%, respectively) with good agreement between young and elder medians. The LSC for cortical porosity (Ct.Po) was somewhat smaller in the radius (0.58%) compared with the distal tibia (0.84%) and significantly different between young and elder medians in the distal tibia (LSC: 0.75% vs. 0.92%, p<0.001). The LSC for pore diameter and distribution (Po.Dm and Po.Dm.SD) ranged between 15 and 23 microm. Bland-Altman analysis revealed moderate bias for integral measures of area and volume but not for density or microarchitecture. This study indicates that HR-pQCT measures of cortical bone density and architecture can be measured in vivo with high reproducibility and limited bias across a biologically relevant range of values. The results of this study provide informative data for the design of future clinical studies of bone quality.
Copyright 2010 Elsevier Inc. All rights reserved.
Figures


References
-
- Laib A, Hauselmann HJ, Ruegsegger P. In vivo high resolution 3D-QCT of the human forearm. Technol Health Care. 1998;6:329–37. - PubMed
-
- Muller R, Hildebrand T, Hauselmann HJ, Ruegsegger P. In vivo reproducibility of three-dimensional structural properties of noninvasive bone biopsies using 3D-pQCT. J Bone Miner Res. 1996;11:1745–50. - PubMed
-
- MacNeil JA, Boyd SK. Accuracy of high-resolution peripheral quantitative computed tomography for measurement of bone quality. Med Eng Phys. 2007;29:1096–105. - PubMed
-
- Burghardt AJ, Kazakia GJ, Majumdar S. A local adaptive threshold strategy for high resolution peripheral quantitative computed tomography of trabecular bone. Ann Biomed Eng. 2007;35:1678–86. - PubMed
-
- Macneil JA, Boyd SK. Bone strength at the distal radius can be estimated from high-resolution peripheral quantitative computed tomography and the finite element method. Bone. 2008;42:1203–13. - PubMed
