Dynamic Granger causality based on Kalman filter for evaluation of functional network connectivity in fMRI data
- PMID: 20561919
- PMCID: PMC4347842
- DOI: 10.1016/j.neuroimage.2010.05.063
Dynamic Granger causality based on Kalman filter for evaluation of functional network connectivity in fMRI data
Abstract
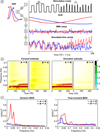
Increasing interest in understanding dynamic interactions of brain neural networks leads to formulation of sophisticated connectivity analysis methods. Recent studies have applied Granger causality based on standard multivariate autoregressive (MAR) modeling to assess the brain connectivity. Nevertheless, one important flaw of this commonly proposed method is that it requires the analyzed time series to be stationary, whereas such assumption is mostly violated due to the weakly nonstationary nature of functional magnetic resonance imaging (fMRI) time series. Therefore, we propose an approach to dynamic Granger causality in the frequency domain for evaluating functional network connectivity in fMRI data. The effectiveness and robustness of the dynamic approach was significantly improved by combining a forward and backward Kalman filter that improved estimates compared to the standard time-invariant MAR modeling. In our method, the functional networks were first detected by independent component analysis (ICA), a computational method for separating a multivariate signal into maximally independent components. Then the measure of Granger causality was evaluated using generalized partial directed coherence that is suitable for bivariate as well as multivariate data. Moreover, this metric provides identification of causal relation in frequency domain, which allows one to distinguish the frequency components related to the experimental paradigm. The procedure of evaluating Granger causality via dynamic MAR was demonstrated on simulated time series as well as on two sets of group fMRI data collected during an auditory sensorimotor (SM) or auditory oddball discrimination (AOD) tasks. Finally, a comparison with the results obtained from a standard time-invariant MAR model was provided.
Copyright 2010 Elsevier Inc. All rights reserved.
Figures


Similar articles
-
Analyzing the connectivity between regions of interest: an approach based on cluster Granger causality for fMRI data analysis.Neuroimage. 2010 Oct 1;52(4):1444-55. doi: 10.1016/j.neuroimage.2010.05.022. Epub 2010 Jun 1. Neuroimage. 2010. PMID: 20472076
-
Identification of MCI using optimal sparse MAR modeled effective connectivity networks.Med Image Comput Comput Assist Interv. 2013;16(Pt 2):319-327. doi: 10.1007/978-3-642-40763-5_40. Med Image Comput Comput Assist Interv. 2013. PMID: 24579156 Free PMC article.
-
A conditional Granger causality model approach for group analysis in functional magnetic resonance imaging.Magn Reson Imaging. 2011 Apr;29(3):418-33. doi: 10.1016/j.mri.2010.10.008. Epub 2011 Jan 12. Magn Reson Imaging. 2011. PMID: 21232892 Free PMC article.
-
Investigating effective brain connectivity from fMRI data: past findings and current issues with reference to Granger causality analysis.Brain Connect. 2012;2(5):235-45. doi: 10.1089/brain.2012.0091. Brain Connect. 2012. PMID: 23016794 Free PMC article. Review.
-
Bayesian networks for fMRI: a primer.Neuroimage. 2014 Feb 1;86:573-82. doi: 10.1016/j.neuroimage.2013.10.020. Epub 2013 Oct 18. Neuroimage. 2014. PMID: 24140939 Review.
Cited by
-
Assessing Cognitive Abilities of Patients With Shift Work Disorder: Insights From RBANS and Granger Causality Connections Among Resting-State Networks.Front Psychiatry. 2020 Aug 6;11:780. doi: 10.3389/fpsyt.2020.00780. eCollection 2020. Front Psychiatry. 2020. PMID: 32848945 Free PMC article.
-
Modeling time-varying brain networks with a self-tuning optimized Kalman filter.PLoS Comput Biol. 2020 Aug 17;16(8):e1007566. doi: 10.1371/journal.pcbi.1007566. eCollection 2020 Aug. PLoS Comput Biol. 2020. PMID: 32804971 Free PMC article.
-
Dynamic Network Connectivity Analysis to Identify Epileptogenic Zones Based on Stereo-Electroencephalography.Front Comput Neurosci. 2016 Oct 27;10:113. doi: 10.3389/fncom.2016.00113. eCollection 2016. Front Comput Neurosci. 2016. PMID: 27833545 Free PMC article.
-
FMRI hemodynamic response function (HRF) as a novel marker of brain function: applications for understanding obsessive-compulsive disorder pathology and treatment response.Brain Imaging Behav. 2021 Jun;15(3):1622-1640. doi: 10.1007/s11682-020-00358-8. Brain Imaging Behav. 2021. PMID: 32761566 Free PMC article.
-
Noninvasive Characterization of Functional Pathways in Layer-Specific Microcircuits of the Human Brain Using 7T fMRI.Brain Sci. 2022 Oct 7;12(10):1361. doi: 10.3390/brainsci12101361. Brain Sci. 2022. PMID: 36291295 Free PMC article.
References
-
- Aguirre GK, Zarahn E, D'esposito M. The variability of human, BOLD hemodynamic responses. Neuroimage. 1998;8:360–369. - PubMed
-
- Akaike H. A new look at the statistical model identification. IEEE transactions on automatic control. 1974;19:716–723.
-
- Ancona N, Marinazzo D, Stramaglia S. Radial basis function approach to nonlinear Granger causality of time series. Physical Review E. 2004;70:056221. - PubMed
-
- Arnold M, Milner XHR, Witte H, Bauer R, Braun C. Adaptive AR modeling of nonstationary time series by means of Kalman filtering. IEEE Transactions on Biomedical Engineering. 1998;45:553–562. - PubMed
-
- Baccala LA, Sameshima K. Partial directed coherence: a new concept in neural structure determination. Biological Cybernetics. 2001;84:463–474. - PubMed
Publication types
MeSH terms
Grants and funding
LinkOut - more resources
Full Text Sources
Medical
Miscellaneous

