. 2010 Aug 27;285(35):27346-27359.
doi: 10.1074/jbc.M110.115634. Epub 2010 Jun 18.

Interactions between intracellular domains as key determinants of the quaternary structure and function of receptor heteromers

Affiliations

Interactions between intracellular domains as key determinants of the quaternary structure and function of receptor heteromers

Gemma Navarro et al. J Biol Chem. .

Abstract

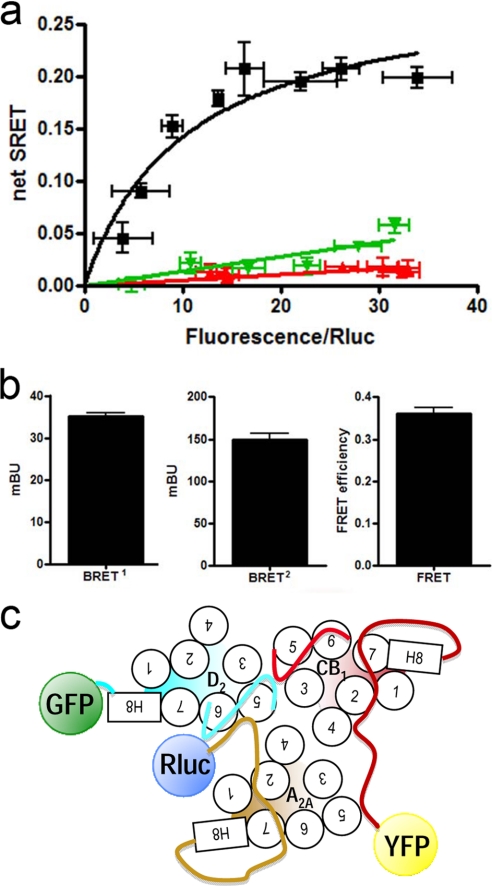
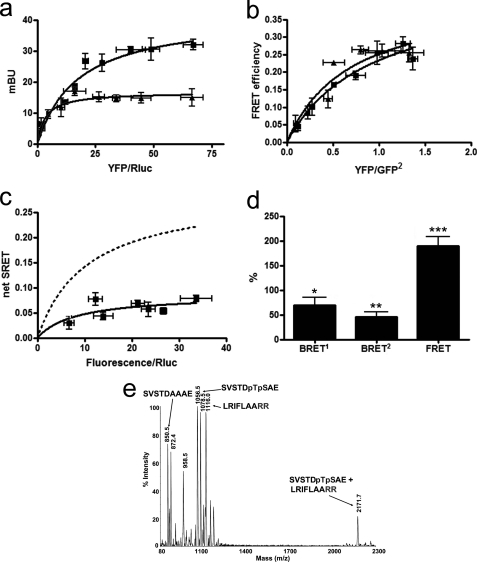
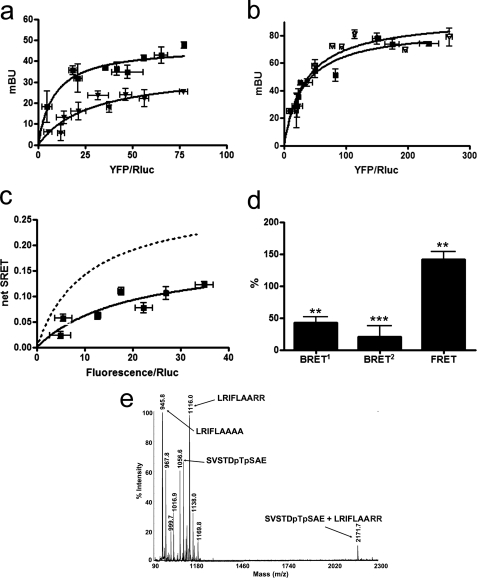
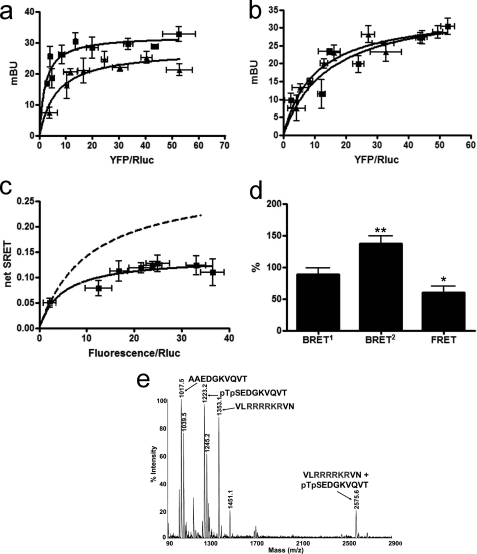
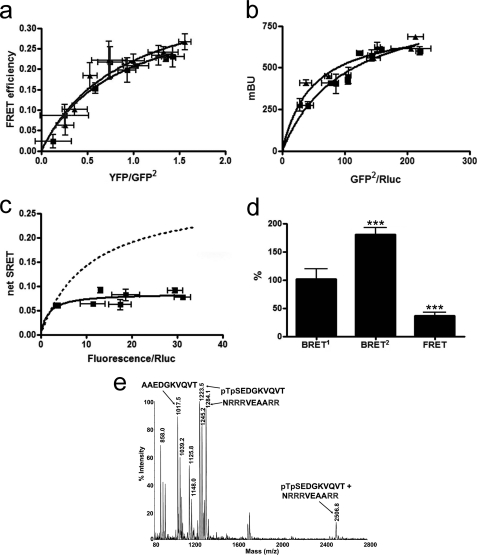
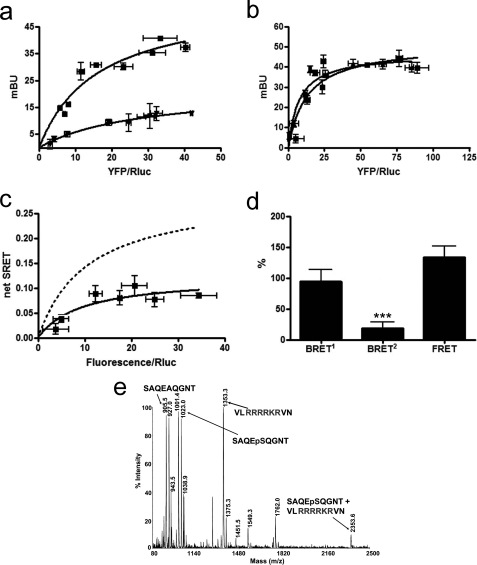
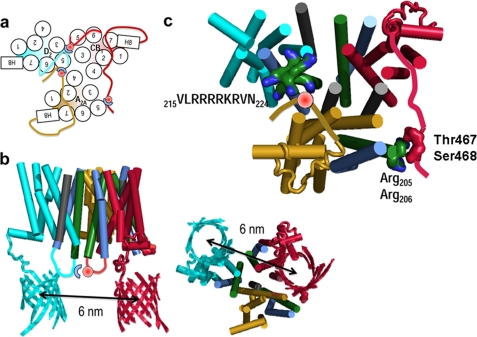
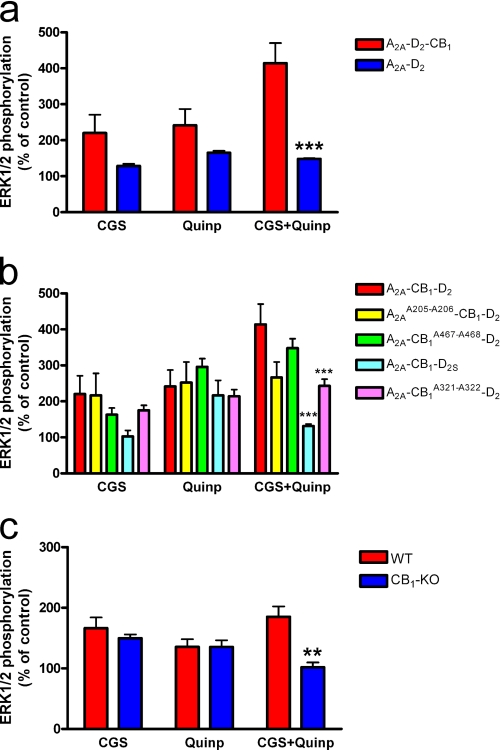
G protein-coupled receptor (GPCR) heteromers are macromolecular complexes with unique functional properties different from those of its individual protomers. Little is known about what determines the quaternary structure of GPCR heteromers resulting in their unique functional properties. In this study, using resonance energy transfer techniques in experiments with mutated receptors, we provide for the first time clear evidence for a key role of intracellular domains in the determination of the quaternary structure of GPCR heteromers between adenosine A(2A), cannabinoid CB(1), and dopamine D(2) receptors. In these interactions, arginine-rich epitopes form salt bridges with phosphorylated serine or threonine residues from CK1/2 consensus sites. Each receptor (A(2A), CB(1), and D(2)) was found to include two evolutionarily conserved intracellular domains to establish selective electrostatic interactions with intracellular domains of the other two receptors, indicating that these particular electrostatic interactions constitute a general mechanism for receptor heteromerization. Mutation experiments indicated that the interactions of the intracellular domains of the CB(1) receptor with A(2A) and D(2) receptors are fundamental for the correct formation of the quaternary structure needed for the function (MAPK signaling) of the A(2A)-CB(1)-D(2) receptor heteromers. Analysis of MAPK signaling in striatal slices of CB(1) receptor KO mice and wild-type littermates supported the existence of A(1)-CB(1)-D(2) receptor heteromer in the brain. These findings allowed us to propose the first molecular model of the quaternary structure of a receptor heteromultimer.


Figures

FIGURE 1.
FIGURE 1.
A2A-CB1-D2 receptor heteromerization in living cells. Assays were performed 48 h post-transfection in cells expressing A2A-Rluc receptor (1 μg of cDNA; ∼100,000 luminescence units), D2-GFP2 receptor (3 μg of cDNA; ∼6,000 fluorescence units), and increasing amounts of CB1-YFP receptor cDNA (8,000–18,000 fluorescence units). In each sample fluorescence or luminescence was measured before every experiment to confirm similar donor expressions while monitoring the increased acceptor expression. a and b, aliquots of these cells were used. a, net SRET2 was obtained by monitoring the YFP fluorescence emission after DeepBlueC addition, with subtraction of the value obtained with cells expressing the same amount of A2A-Rluc and D2-GFP2 receptors. SRET saturation curves (black) were obtained for the coupling of A2A-Rluc, D2-GFP2, and CB1-YFP receptors, although negligible and linear SRET was obtained in cells expressing equivalent amounts of A2A-Rluc, D2-GFP2, and 5HT2B-YFP receptors (green) or D4-Rluc, A2A-GFP2, and CB1-YFP receptors (red). SRET data are expressed as means ± S.D. of 5–8 different experiments grouped as a function of the amount of SRET acceptor. b, BRET1 was obtained by monitoring the YFP fluorescence emission after coelenterazine H addition, with subtraction of the value obtained with cells expressing the same amount of A2A-Rluc receptor. BRET2 was obtained by monitoring the emission of GFP2 fluorescence after DeepBlueC addition, with subtraction of the value obtained with cells expressing the same amount of A2A-Rluc receptors. FRET was measured by monitoring the emission of YFP fluorescence after excitation of GFP2 at 400 nm. Data are expressed as the mean ± S.E. of 5–8 independent experiments performed in duplicate. Linear unmixing of the emission signals was applied to BRET2 and FRET values (b) and for YFP quantification in saturation curves (a). c, schematic representation of the putative triangular quaternary structure of the A2A-CB1-D2 receptor heteromer. mBu, milli-BRET unit.
FIGURE 2.
FIGURE 2.
A2A-CB1A467-A468-D2 receptor heteromerization in living cells. Assays were performed 48 h post-transfection in cells expressing the following: a, A2A-Rluc receptor (1 μg of cDNA; ∼100,000 luminescence units) and increasing amounts of cDNA of the CB1-YFP or CB1A467-A468-YFP receptors (8,000–18,000 fluorescence units); mBu, milli-BRET unit. b, D2-GFP2 (3 μg of the cDNA; ∼6,000 fluorescence units) and increasing amounts of the cDNA for CB1-YFP or CB1A467-A468-YFP; c and d, A2A-Rluc receptor (1 μg of cDNA; ∼100,000 luminescence units), D2-GFP2 receptor (3 μg of the cDNA; ∼6,000 fluorescence units), and increasing amounts of cDNA of the CB1A467-A468-YFP receptor (8,000–18,000 fluorescence units). In each sample, fluorescence or luminescence was measured before every experiment to confirm similar donor expressions while monitoring the increased acceptor expression. a, BRET1 saturation curves for the A2A-Rluc-CB1-YFP receptor pair (squares) and for the A2A-Rluc-CB1A467-A468-YFP receptor pair (triangles) were obtained by monitoring the YFP fluorescence emission after coelenterazine H addition, with subtraction of the value obtained with cells expressing the same amount of A2A-Rluc receptor. Data are expressed as means ± S.D. of five different experiments grouped as a function of the amount of BRET1 acceptor. b, FRET saturation curves for the D2-GFP2-CB1-YFP receptor pair (triangles) and for the D2-GFP2- CB1A467-A468-YFP receptor pair (squares) were obtained by monitoring the YFP fluorescence emission at 530 nm after excitation of GFP2 at 400 nm, with subtraction of the value obtained with cells expressing the same amount of donor protein. Data are expressed as means ± S.D. of seven different experiments grouped as a function of the amount of FRET acceptor. c, net SRET2 was obtained by monitoring the emission of YFP fluorescence after DeepBlueC addition, with subtraction of the value obtained with cells expressing the same amount of A2A-Rluc and D2-GFP2 receptors. SRET saturation curves (solid line) were obtained for the coupling of A2A-Rluc, D2-GFP2, and CB1A467-A468-YFP receptors and compared with the curve obtained for the coupling of A2A-Rluc, D2-GFP2, and CB1-YFP receptors (dotted line, see Fig. 1). SRET data are expressed as means ± S.D. of five different experiments grouped as a function of the amount of SRET acceptor. d, BRET1, BRET2, and FRET were measured as indicated in Fig. 1 legend. Data are expressed as % of values obtained in cells expressing A2A-Rluc, D2-GFP2, and CB1-YFP receptors (control, Fig. 1b), in mean ± S.E. of five independent experiments performed in duplicate. One-way ANOVA followed by Bonferroni test showed significant increases or decreases with respect to the control (*, p < 0.05; **, p < 0.01; ***, p < 0.005). Linear unmixing of the emission signals was applied to the data for BRET2 and FRET values (b and d) and for YFP quantification in saturation curves (a and c). e, the spectrum of a mixture of the following three peptides SVSTDAAAE, SVSTDpTpSAE, and LRIFLAARR, shows only one noncovalent complex between SVSTDpTpSAE and LRIFLAARR at 2171.7 atomic mass units (see text).
FIGURE 3.
FIGURE 3.
A2AA205-A206-CB1-D2 receptor heteromerization in living cells. Assays were performed 48 h post-transfection in cells expressing the following: a, A2A-Rluc or A2AA205-A206-Rluc receptors (1 or 0.8 μg of cDNA respectively; ∼100,000 luminescence units) and increasing amounts of the cDNA of the CB1-YFP receptor (8,000–18,000 fluorescence units). mBu, milli-BRET unit. b, A2A-Rluc or A2AA205-A206-Rluc (1 or 0.8 μg of cDNA, respectively; ∼100,000 luminescence units) and increasing amounts of the cDNA for D2-YFP. c and d, A2AA205-A206-Rluc receptor (1 μg of cDNA; ∼100,000 luminescence units), D2-GFP2 receptor (3 μg of the cDNA; ∼6,000 fluorescence units), and increasing amounts of cDNA of the CB1-YFP receptor (8,000–18,000 fluorescence units). In each sample fluorescence or luminescence was measured before every experiment to confirm similar donor expressions while monitoring the increased acceptor expression. a, BRET1 saturation curves for the A2A-Rluc-CB1-YFP receptor pairs (squares) and for the A2AA205-A206-Rluc-CB1-YFP receptor pair (triangles) were obtained by monitoring the YFP fluorescence emission after coelenterazine H addition, with subtraction of the value obtained with cells expressing the same amount of donor. Data are expressed as means ± S.D. of five different experiments grouped as a function of the amount of BRET1 acceptor. b, BRET1 saturation curves for the A2A-Rluc-D2-YFP receptor pairs (triangles) and for the A2AA205-A206-Rluc-D2-YFP receptor pair (squares) were obtained by monitoring the YFP fluorescence emission after coelenterazine H addition, with subtraction of the value obtained with cells expressing the same amount of donor. Data are expressed as means ± S.D. of five different experiments grouped as a function of the amount of BRET1 acceptor. c, net SRET2 was obtained by monitoring the YFP fluorescence emission after DeepBlueC addition, with subtraction of the value obtained with cells expressing the same amount of A2AA205-A206-Rluc and D2-GFP2 receptors. SRET saturation curves (solid line) were obtained for the coupling of A2AA205-A206Rluc, D2-GFP2, and CB1-YFP receptors and compared with the curve obtained for the coupling of A2A-Rluc, D2R-GFP2, and CB1-YFP receptors (dotted line, see Fig. 1). SRET data are expressed as means ± S.D. of five different experiments grouped as a function of the amount of SRET acceptor. d, BRET1, BRET2, and FRET were measured as indicated in Fig. 1 legend. Data are expressed as % of values obtained in cells expressing A2A-Rluc, D2-GFP2, and CB1-YFP receptors (control, Fig. 1b), in mean ± S.E. of five independent experiments performed in duplicate. One-way ANOVA followed by Bonferroni test showed significant increases or decreases with respect to the control (**, p < 0.01; ***, p < 0.005). Linear unmixing of the emission signals was applied to the data for BRET2 and FRET values (d) and for YFP quantification in saturation curves (a–c). e, spectrum of a mixture of the following three peptides LRIFLAAAA, LRIFLAARR, and SVSTDpTpSAE, shows only one NCX between SVSTDpTpSAE and LRIFLAARR at 2171.7 atomic mass units (see text).
FIGURE 4.
FIGURE 4.
A2A-CB1A321-A322-D2 receptor heteromerization in living cells. Assays were performed 48 h post-transfection in cells expressing the following: a, D2-Rluc receptor (1 μg of cDNA; ∼100,000 luminescence units) and increasing amounts of the cDNA for CB1-YFP or CB1A321-A322-YFP receptors (8,000–18,000 fluorescence units); b, A2A-Rluc (1 μg of cDNA; ∼100,000 luminescence units) and increasing amounts of the cDNA for CB1-YFP or CB1A321-A322-YFP; c and d, A2A-Rluc receptor (1 μg of cDNA; ∼100,000 luminescence units), D2-GFP2 receptor (3 μg of the cDNA; ∼6,000 fluorescence units), and increasing amounts of cDNA of the CB1A321-A322-YFP receptor (8,000–18,000 fluorescence units). In each sample fluorescence or luminescence was measured before every experiment to confirm similar donor expressions while monitoring the increased acceptor expression. a, BRET1 saturation curves for the D2-Rluc-CB1-YFP receptor pair (squares) and for D2-Rluc-CB1A321-A322-YFP receptor pair (triangles) were obtained by monitoring the YFP fluorescence emission after coelenterazine H addition, with subtraction of the value obtained with cells expressing the same amount of A2A-Rluc receptor. Data are expressed as means ± S.D. of six different experiments grouped as a function of the amount of BRET1 acceptor. b, BRET1 saturation curves for the A2A-Rluc-CB1-YFP receptor pair (triangles) and for A2A-Rluc-CB1A321-A322-YFP receptor pair (squares) were obtained by monitoring the YFP fluorescence emission after coelenterazine H addition, with subtraction of the value obtained with cells expressing the same amount of A2A-Rluc receptor. Data are expressed as means ± S.D. of six different experiments grouped as a function of the amount of BRET1 acceptor. c, net SRET2 was obtained by monitoring the YFP fluorescence emission after DeepBlueC addition, with subtraction of the value obtained with cells expressing the same amount of A2A-Rluc and D2-GFP2 receptors. SRET saturation curves (solid line) were obtained for the coupling of A2A-Rluc, D2-GFP2, and CB1A321-A322-YFP receptors and compared with the curve obtained for the coupling of A2A-Rluc, D2-GFP2, and CB1-YFP receptors (dotted line, see Fig. 1). SRET data are expressed as means ± S.D. of six different experiments grouped as a function of the amount of SRET acceptor. d, BRET1, BRET2, and FRET were measured as indicated in Fig. 1b legend. Data are expressed as percent of values obtained in cells expressing A2A-Rluc, D2-GFP2, and CB1-YFP receptors (control, Fig. 1b), in mean ± S.E. of six independent experiments performed in duplicate. One-way ANOVA followed by Bonferroni test showed significant increases or decreases with respect to the control (*, p < 0.05; **, p < 0.01). Linear unmixing of the emission signals was applied to the data for BRET2 and FRET values (d) and for YFP quantification in saturation curves (a–c). e, the spectrum of a mixture of the following three peptides AAEDGKVQVT, pTpSEDGKVQVT, and VLRRRRKRVN shows only one NCX between pTpSEDGKVQVT and VLRRRRKRVN at 2575.6 atomic mass units (see text). mBu, milli-BRET unit.
FIGURE 5.
FIGURE 5.
A2A-CB1-D2S receptor heteromerization in living cells. Assays were performed 48 h post-transfection in cells expressing the following: a, D2S-GFP2 receptor (1.5 μg of cDNA; ∼5,000 fluorescence units) or D2-GFP2 receptor (2 μg of cDNA; ∼5,000 luminescence units), and increasing amounts of cDNA of CB1-YFP receptor (8,000–18,000 fluorescence units); b, A2A-Rluc (1 μg of cDNA; ∼100,000 luminescence units) and increasing amounts of cDNA for D2-GFP2 or D2S-GFP2; c and d, A2A-Rluc receptor (1 μg of cDNA; ∼100,000 luminescence units), D2S-GFP2 receptor (3 μg of the cDNA; ∼6,000 fluorescence units) and increasing amounts of the cDNA for CB1-YFP receptor (8,000–18,000 fluorescence units). mBu, milli-BRET unit. In each sample fluorescence or luminescence was measured before every experiment to confirm similar donor expressions while monitoring the increased acceptor expression. a, FRET saturation curves for the D2-GFP2-CB1-YFP receptor pair (squares) and for D2S-GFP2-CB1-YFP receptor pair (triangles) were obtained by monitoring the YFP fluorescence emission at 530 nm after excitation of GFP2 at 400 nm, with subtraction of the value obtained with cells expressing the same amount of donor protein. Data are expressed as means ± S.D. of seven different experiments grouped as a function of the amount of FRET acceptor. b, BRET2 saturation curves for the A2A-Rluc-D2-GFP2 receptor pair (triangles) and for A2A-Rluc-D2S-GFP2 receptor pair (squares) were obtained by monitoring the YFP fluorescence emission after DeepBlueC addition, with subtraction of the value obtained with cells expressing the same amount of A2A-Rluc receptor. Data are expressed as means ± S.D. of six different experiments grouped as a function of the amount of BRET2 acceptor. c, net SRET2 was obtained by monitoring the YFP fluorescence emission after DeepBlueC addition, with subtraction of the value obtained with cells expressing the same amount of A2A-Rluc and D2S-GFP2 receptors. SRET saturation curves (solid line) were obtained for the coupling of A2A-Rluc, D2S-GFP2, and CB1-YFP receptors and compared with the curve obtained for the coupling of A2A-Rluc, D2-GFP2, and CB1-YFP receptors (dotted line, see Fig. 1). SRET data are expressed as means ± S.D. of five different experiments grouped as a function of the amount of SRET acceptor. d, BRET1, BRET2, and FRET were measured as indicated in Fig. 1 legend. Data are expressed as % of values obtained in cells expressing A2ARluc, D2-GFP2, and CB1-YFP receptors (control, Fig. 1b), in mean ± S.E. of five independent experiments performed in duplicate. One-way ANOVA followed by Bonferroni test showed significant increases or decreases with respect to the control (***, p < 0.005). Linear unmixing of the emission signals was applied to the data for BRET2 and FRET values (a, b, and d) and for YFP quantification in saturation curves (a and c). e, spectrum of a mixture of the following three peptides AAEDGKVQVT, pTpSEDGKVQVT, and NRRRVEAARR, shows only one NCX between pTpSEDGKVQVT and NRRRVEAARR at 2506.8 atomic mass units (see text).
FIGURE 6.
FIGURE 6.
A2AA374-CB1-D2 receptor heteromerization in living cells. Assays were performed 48 h post-transfection in cells expressing the following: a, A2A-Rluc or A2AA374-Rluc receptors (1 or 0.8 μg of cDNA respectively; ∼100,000 luminescence units) and increasing amounts of cDNA of the D2-YFP receptor (8,000–18,000 fluorescence units); b, A2A-Rluc or A2AA374-Rluc (1 or 0.8 μg of cDNA respectively; ∼100,000 luminescence units) and increasing amounts of the cDNA for CB1R-YFP; c and d, A2AA374-Rluc receptor (1 μg of cDNA; ∼100,000 luminescence units), D2-GFP2 receptor (3 μg of the cDNA; ∼6,000 fluorescence units), and increasing amounts of cDNA of CB1-YFP receptor (8,000–18,000 fluorescence units). In each sample fluorescence or luminescence was measured before every experiment to confirm similar donor expressions while monitoring the increased acceptor expression. a, BRET1 saturation curves for the A2A-Rluc-D2-YFP receptor pair (squares) and for the A2AA374-Rluc-D2-YFP receptor pair (triangles) were obtained by monitoring the YFP fluorescence emission after coelenterazine H addition, with subtraction of the value obtained with cells expressing the same amount of donor. Data are expressed as means ± S.D. of five different experiments grouped as a function of the amount of BRET1 acceptor. b, BRET1 saturation curves for the A2A-Rluc-CB1-YFP receptor pair (triangles) and for the A2AA374-Rluc-CB1-YFP receptor pair (squares) were obtained by monitoring the YFP fluorescence emission after coelenterazine H addition, with subtraction of the value obtained with cells expressing the same amount of donor. Data are expressed as means ± S.D. of five different experiments grouped as a function of the amount of BRET1 acceptor. c, net SRET2 was obtained by monitoring the YFP fluorescence emission after DeepBlueC addition, with subtraction of the value obtained with cells expressing the same amount of A2AA374-Rluc and D2-GFP2 receptors. SRET saturation curves (solid line) were obtained for the coupling of A2AA374-Rluc, D2-GFP2, and CB1-YFP receptors and compared with the curve obtained for the coupling of A2A-Rluc, D2-GFP2, and CB1-YFP receptors (dotted line, see Fig. 1). SRET data are expressed as mean ± S.D. of five different experiments grouped as a function of the amount of SRET acceptor. d, BRET1, BRET2, and FRET were measured as indicated in Fig. 1 legend. Data are expressed as % of values obtained in cells expressing A2A-Rluc, D2-GFP2, and CB1-YFP (control, Fig. 1b) in mean ± S.E. of five independent experiments performed in duplicate. One-way ANOVA followed by Bonferroni test showed significant increases or decreases with respect to the control (*, p < 0.05; **, p < 0.01; ***, p < 0.005). Linear unmixing of the emission signals was applied to the data for BRET2 and FRET values (e) and for YFP quantification in saturation curves (a and b). e, spectrum of a mixture of the following three peptides SAQEAQGNT, SAQEpSQGNT, and VLRRRRKRVN shows only one NCX between SAQEpSQGNT and VLRRRRKRVN at 2353.6 atomic mass units (see text). mBu, milli-BRET unit.
FIGURE 7.
FIGURE 7.
A2A-CB1-D2 receptor heteromerization in living cells treated with casein kinase 1/2 inhibitors. SRET2 saturation experiments were performed 48 h post-transfection in cells expressing A2A-Rluc receptor (1 μg of cDNA), D2-GFP2 receptor (3 μg of cDNA),and increasing amounts of CB1-YFP receptor cDNA, treated with the casein kinase 1 inhibitor IC 261 (50 μm) and casein kinase 2 inhibitor TBAC (10 μm) as described under “Experimental Procedures.” In each sample fluorescence or luminescence was measured before every experiment to confirm similar donor expressions (∼100,000 luminescence units) and similar GFP2 fluorescence (∼6,000 fluorescence units) while monitoring the increased acceptor expression (8,000–18,000 YFP fluorescence units). Net SRET2 was obtained by monitoring the emission of YFP fluorescence after DeepBlueC addition, with subtraction of the value obtained with cells expressing the same amount of receptor Rluc and receptor GFP2. SRET2 saturation curves (solid lines) were compared with the curve obtained for the coupling of A2A-Rluc, D2-GFP2, and CB1-YFP receptors in cells not treated with casein kinase inhibitors (dotted line, see Fig. 1). SRET data are expressed as means ± S.D. of five different experiments grouped as a function of the amount of SRET acceptor.
FIGURE 8.
FIGURE 8.
Molecular model of the A2A-CB1-D2 receptor heteromer. a, schematic model of the heteromerization of A2A (gold), CB1 (red), and D2 (cyan) receptors. Solid lines between TM5 and -6 symbolize IL3 of CB1 (red line, 29 amino acids long) or D2 (cyan line, 142 amino acids long) receptors, which were not modeled; solid lines after HX8 represent CT of CB1 (red line) or A2A (gold line), which were arbitrarily modeled as in squid rhodopsin; red spheres represent either phosphorylated Thr321(IL3)–Ser322(IL3) or Thr467(CT)–Ser468(CT) of CB1 or phosphorylated Ser374(CT) of A2A; and blue half-circles represent either Arg205(5.66)–Arg206(5.67) of A2A or the 215(5.64)VLRRRRKRVN224 or 266NRRRVEAARR275(IL3) epitopes of D2. b, lateral and cytoplasmic views of the computational model of the A2A-CB1-D2 receptor heteromer. GFP fused to Cys443(CT) of the D2 receptor (cyan surface) and YFP fused to Leu472(CT) of the CB1 receptor (red surface) are shown. IL3 of CB1 (red line) and D2 (cyan line) receptors are shown in solid lines to illustrate their proximity. c, cytoplasmic view of the computational model of the A2A-CB1-D2 receptor heteromer. CT of the CB1 receptor is depicted in the following manner: amino acids Ser414–Asn437 of (red tube ribbon) are modeled as in the crystal structure of squid rhodopsin, amino acids Asn437–Asp466 (not modeled) are shown as a red solid line to illustrate the position of Thr467–Ser468, and amino acids Ala469–Leu472 (red solid line) are arbitrarily modeled to position YFP. CT of the A2A receptor is depicted in the following manner: amino acids Ser305–Gly328 (golden tube ribbon) are modeled as in the crystal structure of squid rhodopsin; amino acids Ser329–Ser412 (not modeled) are shown as a yellow solid line, and phosphorylated Ser374 is shown as a red circle. Helices are shown as cylinders with the following color codes: TM4 in gray, TM5 in green, TM6 in blue, and the other helices in yellow for A2A, in red for CB1, and cyan for D2 receptors.
FIGURE 9.
FIGURE 9.
Agonist-induced ERK1/2 phosphorylation by the A2A-D2-CB1 receptor heteromer. a and b, assays were performed 48 h post-transfection in cells expressing the indicated receptors (1.2 μg of cDNA of the A2A or the A2AA205-A206 receptors, 1 μg of cDNA of the D2, 0.8 μg of cDNA of the D2S receptor, and 1 μg of cDNA of the CB1, CB1A467-A468, or the CB1A321-A322 receptors). Cells were treated for 5 min with 200 nm CGS 21680 (CGS), 1 μm quinpirole (Quinp), or both (CGS+Quinp) and ERK1/2 phosphorylation was determined as indicated under “Experimental Procedures.” The immunoreactive bands from four experiments performed in duplicate were quantified, and the values represent the mean ± S.E. of % of phosphorylation relative to the basal levels found in untreated cells. c, assays were performed in striatal slices from wild-type (WT) or CB1 knock-out mice (CB1-KO). The slices were treated for 10 min with 1 μm CGS 21680 (CGS), 1 μm quinpirole (quinpirole) or both, and ERK1/2 phosphorylation was determined as indicated under “Experimental Procedures.” The immunoreactive bands from four to eight slices obtained from five to nine animals were quantified, and values represent the mean ± S.E. of the % of phosphorylation relative to basal levels found in untreated slices. Significant differences respect to the wild-type mice were calculated by bifactorial ANOVA followed by post hoc Bonferroni's tests (**, p < 0.01; ***, p < 0.001).

Similar articles

Cited by

References

    1. Ferré S., Ciruela F., Woods A. S., Lluis C., Franco R. (2007) Trends Neurosci. 30, 440–446 - PubMed
    1. Pin J. P., Neubig R., Bouvier M., Devi L., Filizola M., Javitch J. A., Lohse M. J., Milligan G., Palczewski K., Parmentier M., Spedding M. (2007) Pharmacol. Rev. 59, 5–13 - PubMed
    1. Ferré S., Baler R., Bouvier M., Caron M. G., Devi L. A., Durroux T., Fuxe K., George S. R., Javitch J. A., Lohse M. J., Mackie K., Milligan G., Pfleger K. D., Pin J. P., Volkow N. D., Waldhoer M., Woods A. S., Franco R. (2009) Nat. Chem. Biol. 5, 131–134 - PMC - PubMed
    1. Dalrymple M. B., Pfleger K. D., Eidne K. A. (2008) Pharmacol. Ther. 118, 359–371 - PubMed
    1. Carriba P., Navarro G., Ciruela F., Ferré S., Casadó V., Agnati L., Cortés A., Mallol J., Fuxe K., Canela E. I., Lluís C., Franco R. (2008) Nat. Methods 5, 727–733 - PubMed

Publication types