. 2010 Sep;117(1):122-32.
doi: 10.1093/toxsci/kfq184. Epub 2010 Jun 18.

cPLA2 is protective against COX inhibitor-induced intestinal damage

Affiliations

cPLA2 is protective against COX inhibitor-induced intestinal damage

David C Montrose et al. Toxicol Sci. 2010 Sep.

Abstract

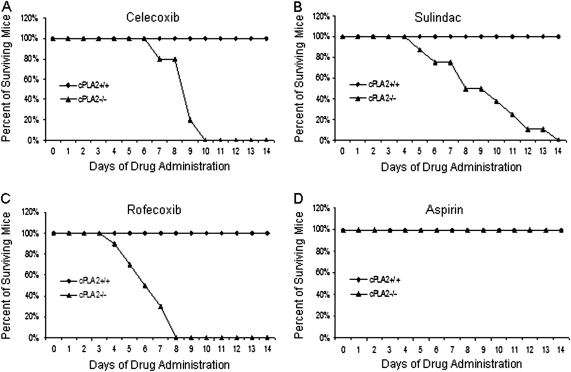
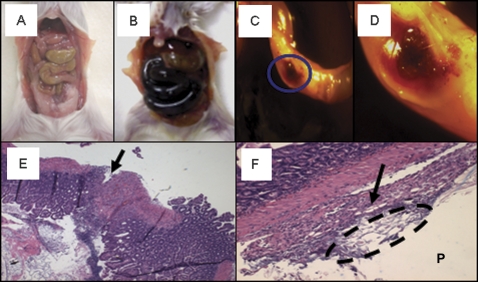
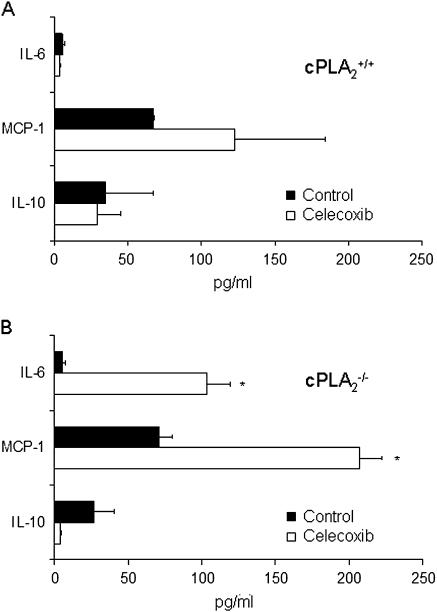
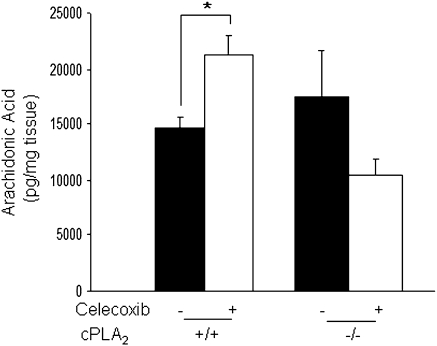
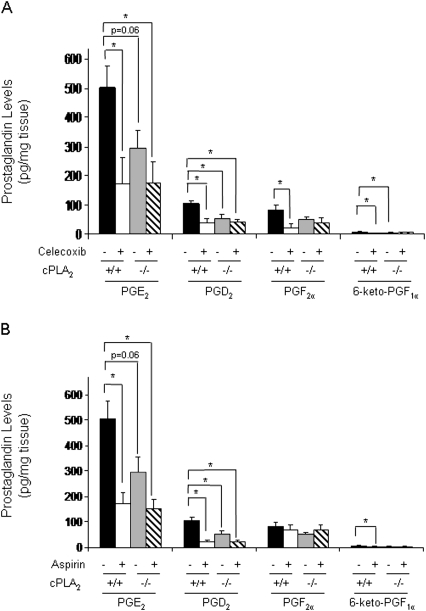
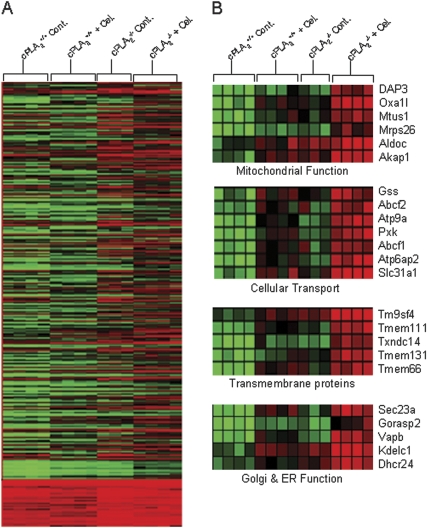
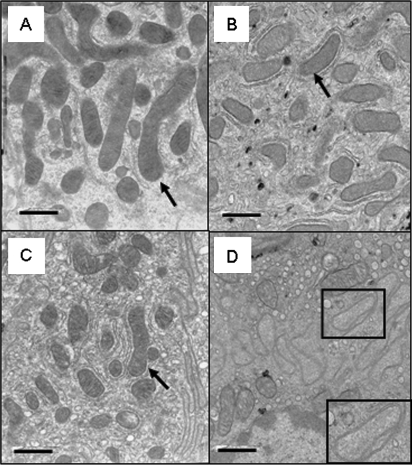
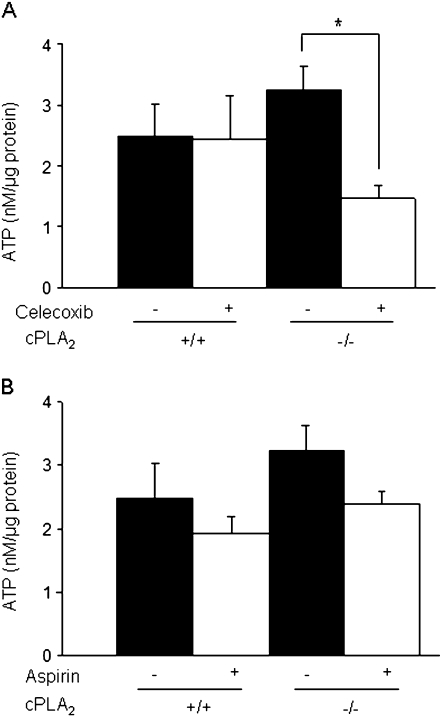
Cytosolic phospholipase A(2) (cPLA(2)) is the rate-limiting enzyme responsible for the generation of prostaglandins (PGs), which are bioactive lipids that play critical roles in maintaining gastrointestinal (GI) homeostasis. There has been a long-standing association between administration of cyclooxygenase (COX) inhibitors and GI toxicity. GI injury is thought to be induced by suppressed production of GI-protective PGs as well as direct injury to enterocytes. The present study sought to determine how pan-suppression of PG production via a genetic deletion of cPLA(2) impacts the susceptibility to COX inhibitor-induced GI injury. A panel of COX inhibitors including celecoxib, rofecoxib, sulindac, and aspirin were administered via diet to cPLA(2)(-/-) and cPLA(2)(+/+) littermates. Administration of celecoxib, rofecoxib, and sulindac, but not aspirin, resulted in acute lethality (within 2 weeks) in cPLA(2)(-/-) mice, but not in wild-type littermates. Histomorphological analysis revealed severe GI damage following celecoxib exposure associated with acute bacteremia and sepsis. Intestinal PG levels were reduced equivalently in both genotypes following celecoxib exposure, indicating that PG production was not likely responsible for the differential sensitivity. Gene expression profiling in the small intestines of mice identified drug-related changes among a panel of genes including those involved in mitochondrial function in cPLA(2)(-/-) mice. Further analysis of enterocytic mitochondria showed abnormal morphology as well as impaired ATP production in the intestines from celecoxib-exposed cPLA(2)(-/-) mice. Our data demonstrate that cPLA(2) appears to be an important component in conferring protection against COX inhibitor-induced enteropathy, which may be mediated through affects on enterocytic mitochondria.


Figures

FIG. 1.
FIG. 1.
Survival curve of mice treated with COX inhibitors. cPLA2+ / + and cPLA2− / − mice were placed on diets containing celecoxib (0.15%), rofecoxib (0.0075%), sulindac (0.015%), or aspirin (0.05%), and mortality was recorded. The graph shows the percentage of surviving mice following the start of administration (day 0) of (A) celecoxib, (B) sulindac, (C) rofecoxib, or (D) aspirin. The data represent a minimum of 10 mice per group.
FIG. 2.
FIG. 2.
Effects of celecoxib exposure on small intestinal pathology. Representative photomicrographs are shown of the abdominal cavities of a (A) cPLA2+ / + mouse and a (B) cPLA2− / − mouse after celecoxib exposure (0.15% incorporated in chow for 8 days). Closer examination of cPLA2− / − intestines showed perforations throughout the intestinal wall (C, circle [×1], D [×3] [magnification of C]). Histological evaluation of hematoxylin and eosin sections shows ulceration with near rupture (arrow) within the intestinal wall (E) (×100); Peritonitis (arrow) and fecal material (dashed circle) were observed on the peritoneal side (P) of the small intestine (F) (×100).
FIG. 3.
FIG. 3.
Effects of celecoxib exposure on serum cytokine levels. Cytokine levels were measured in the serum of (A) cPLA2+ / + and (B) cPLA2− / − mice fed control or celecoxib-incorporated chow for 5–9 days. *p < 0.05 as compared with control samples for each cytokine as determined by unpaired t-tests. Data represent the means ± standard errors of the mean of three mice per group.
FIG. 4.
FIG. 4.
Measurement of intestinal AA production. AA levels were measured by GC/MS in the small intestines of cPLA2+ / + and cPLA2− / − mice under control conditions and after 3 days of celecoxib administration. Data represent the means ± standard errors of the mean of six mice per group. *p < 0.05 as determined by one-way ANOVA followed by unpaired t-tests.
FIG. 5.
FIG. 5.
The effects of COX inhibitor administration on PG levels in the small intestine. (A) PG levels were measured by liquid chromatography/MS in the small intestines of cPLA2+ / + and cPLA2− / − mice fed control or celecoxib-incorporated chow for 3 days. (B) PG levels were measured as described in (A), but aspirin was given in place of celecoxib. Statistical analysis was performed by one-way ANOVA followed by post-hoc analysis using unpaired t-tests. Data represent the means ± standard errors of the mean of four to six mice per group. A p value ≤ 0.05 is considered statistically significant.
FIG. 6.
FIG. 6.
Global gene expression analysis in intestinal tissues. (A) Gene expression patterns were examined by microarray analysis in the small intestines of cPLA2+ / + and cPLA2− / − mice fed control or celecoxib-incorporated chow for a total of 3 days. Signal intensities were determined using the K-means clustering algorithm as described under Materials and Methods section. A total of 1579 genes were determined to be significantly different (p ≤ 0.05) between groups using one-way ANOVA. (B) Genes found to be more markedly altered after celecoxib exposure in cPLA2− / − mice were categorized by function and shown as a heat map representing gene signal intensities.
FIG. 7.
FIG. 7.
Effects of celecoxib exposure on mitochondrial morphology. Representative photomicrographs of mitochondria as visualized by electron microscopy within enterocytes from (A) cPLA2+ / + mice fed control chow or (B) celecoxib-incorporated chow for 8 h and (C) cPLA2− / − mice fed control chow or (D) celecoxib-incorporated chow for 8 h are shown. Mitochondria were examined for morphological abnormalities as described under Materials and Methods section. Mitochondria are indicated by arrows. A representative mitochondrion showing evidence of matrix paling and disrupted cristae is indicated by a box (D, inset). (Magnification: ×16,525, scale bar = 1 μm).
FIG. 8.
FIG. 8.
Effects of celecoxib exposure on intestinal mitochondrial ATP production. (A) ATP production was measured in isolated mitochondria from enterocytes as described under Materials and Methods section in cPLA2+ / + and cPLA2− / − mice fed control or celecoxib-incorporated chow for 3 days. (B) ATP production was measured in the same groups as described in (A), but mice were given aspirin in place of celecoxib. Data were compared by one-way ANOVA followed by unpaired t-tests and a p value ≤ 0.05 was considered statistically significant. Data represent the means ± standard errors of the mean of six mice per group.

References

    1. Adler DH, Cogan JD, Phillips JA, III, Schnetz-Boutaud N, Milne GL, Iverson T, Stein JA, Brenner DA, Morrow JD, Boutaud O, et al. Inherited human cPLA(2alpha) deficiency is associated with impaired eicosanoid biosynthesis, small intestinal ulceration, and platelet dysfunction. J. Clin. Invest. 2008;118:2121–2131. - PMC - PubMed
    1. Bidgood MJ, Jamal OS, Cunningham AM, Brooks PM, Scott KF. Type IIA secretory phospholipase A2 up-regulates cyclooxygenase-2 and amplifies cytokine-mediated prostaglandin production in human rheumatoid synoviocytes. J. Immunol. 2000;165:2790–2797. - PubMed
    1. Bjarnason I, Hayllar J, MacPherson AJ, Russell AS. Side effects of nonsteroidal anti-inflammatory drugs on the small and large intestine in humans. Gastroenterology. 1993;104:1832–1847. - PubMed
    1. Bombardier C, Laine L, Reicin A, Shapiro D, Burgos-Vargas R, Davis B, Day R, Ferraz MB, Hawkey CJ, Hochberg MC, et al. Comparison of upper gastrointestinal toxicity of rofecoxib and naproxen in patients with rheumatoid arthritis. VIGOR Study Group. N. Engl. J. Med. 2000;343:1520–1528. 2 p following 1528. - PubMed
    1. Bradford MM. A rapid and sensitive method for the quantitation of microgram quantities of protein utilizing the principle of protein-dye binding. Anal. Biochem. 1976;72:248–254. - PubMed

Publication types

MeSH terms