

Increased lipid accumulation in the Chlamydomonas reinhardtii sta7-10 starchless isoamylase mutant and increased carbohydrate synthesis in complemented strains
- PMID: 20562225
- PMCID: PMC2918938
- DOI: 10.1128/EC.00075-10
Increased lipid accumulation in the Chlamydomonas reinhardtii sta7-10 starchless isoamylase mutant and increased carbohydrate synthesis in complemented strains
Abstract
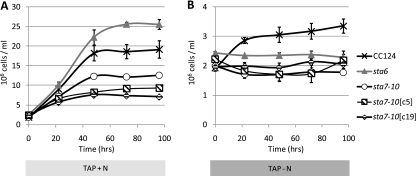
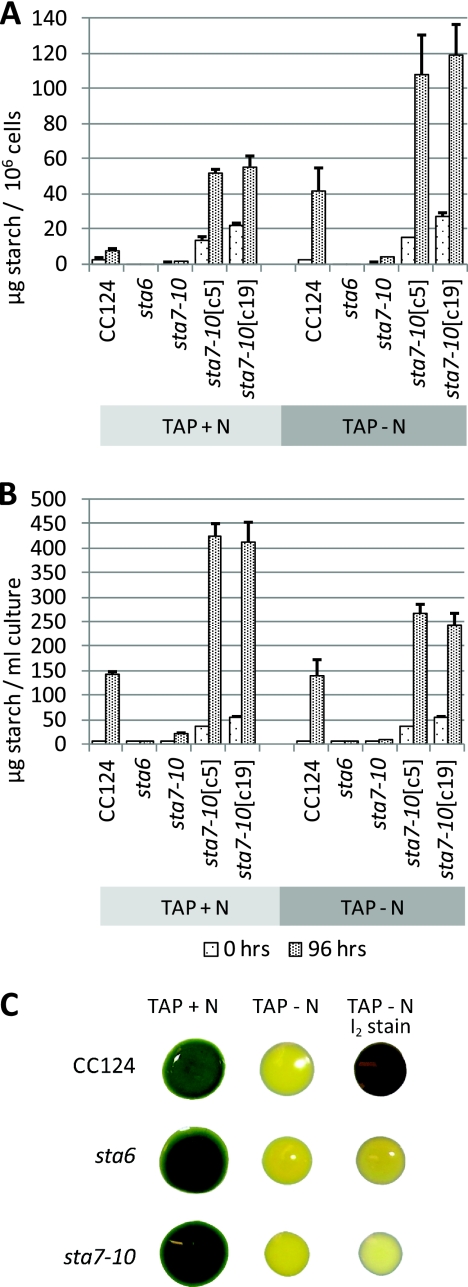
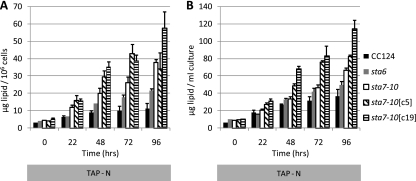
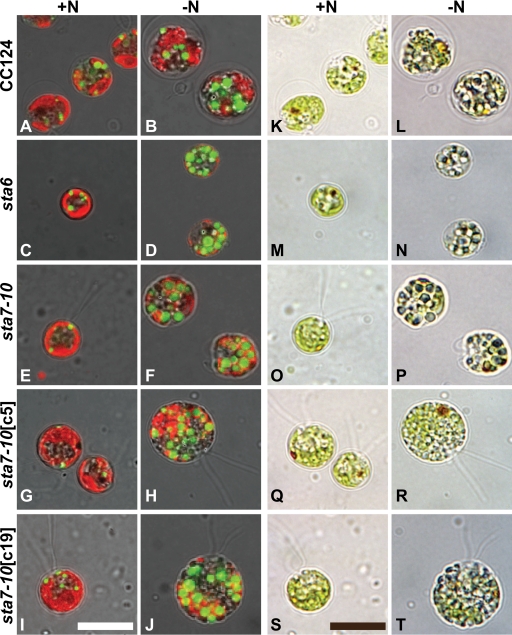
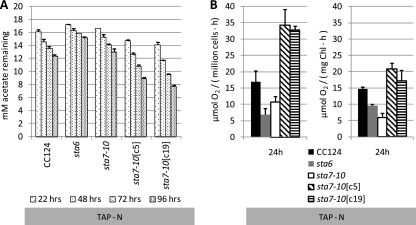
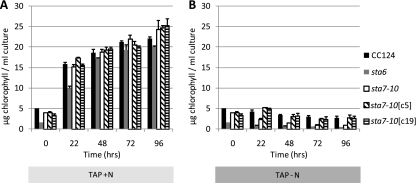
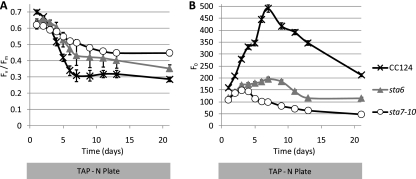
The accumulation of bioenergy carriers was assessed in two starchless mutants of Chlamydomonas reinhardtii (the sta6 [ADP-glucose pyrophosphorylase] and sta7-10 [isoamylase] mutants), a control strain (CC124), and two complemented strains of the sta7-10 mutant. The results indicate that the genetic blockage of starch synthesis in the sta6 and sta7-10 mutants increases the accumulation of lipids on a cellular basis during nitrogen deprivation relative to that in the CC124 control as determined by conversion to fatty acid methyl esters. However, this increased level of lipid accumulation is energetically insufficient to completely offset the loss of cellular starch that is synthesized by CC124 during nitrogen deprivation. We therefore investigated acetate utilization and O(2) evolution to obtain further insights into the physiological adjustments utilized by the two starchless mutants in the absence of starch synthesis. The results demonstrate that both starchless mutants metabolize less acetate and have more severely attenuated levels of photosynthetic O(2) evolution than CC124, indicating that a decrease in overall anabolic processes is a significant physiological response in the starchless mutants during nitrogen deprivation. Interestingly, two independent sta7-10:STA7 complemented strains exhibited significantly greater quantities of cellular starch and lipid than CC124 during acclimation to nitrogen deprivation. Moreover, the complemented strains synthesized significant quantities of starch even when cultured in nutrient-replete medium.
Figures
Similar articles
-
Hydrogen photoproduction is attenuated by disruption of an isoamylase gene in Chlamydomonas reinhardtii.Plant Cell. 2004 Aug;16(8):2151-63. doi: 10.1105/tpc.104.021972. Epub 2004 Jul 21. Plant Cell. 2004. PMID: 15269330 Free PMC article.
-
Oil accumulation in the model green alga Chlamydomonas reinhardtii: characterization, variability between common laboratory strains and relationship with starch reserves.BMC Biotechnol. 2011 Jan 21;11:7. doi: 10.1186/1472-6750-11-7. BMC Biotechnol. 2011. PMID: 21255402 Free PMC article.
-
Systems-level analysis of nitrogen starvation-induced modifications of carbon metabolism in a Chlamydomonas reinhardtii starchless mutant.Plant Cell. 2013 Nov;25(11):4305-23. doi: 10.1105/tpc.113.117580. Epub 2013 Nov 26. Plant Cell. 2013. PMID: 24280389 Free PMC article.
-
Metabolic and photosynthetic consequences of blocking starch biosynthesis in the green alga Chlamydomonas reinhardtii sta6 mutant.Plant J. 2015 Mar;81(6):947-60. doi: 10.1111/tpj.12783. Plant J. 2015. PMID: 25645872
-
Algal lipid bodies: stress induction, purification, and biochemical characterization in wild-type and starchless Chlamydomonas reinhardtii.Eukaryot Cell. 2009 Dec;8(12):1856-68. doi: 10.1128/EC.00272-09. Epub 2009 Oct 30. Eukaryot Cell. 2009. PMID: 19880756 Free PMC article.
Cited by
-
Genetic Impairment of Cellulose Biosynthesis Increases Cell Wall Fragility and Improves Lipid Extractability from Oleaginous Alga Nannochloropsis salina.Microorganisms. 2020 Aug 6;8(8):1195. doi: 10.3390/microorganisms8081195. Microorganisms. 2020. PMID: 32781613 Free PMC article.
-
Relevance of nutrient media composition for hydrogen production in Chlamydomonas.Photosynth Res. 2015 Sep;125(3):395-406. doi: 10.1007/s11120-015-0152-7. Epub 2015 May 8. Photosynth Res. 2015. PMID: 25952745 Review.
-
Dynamics of Photosynthesis in a Glycogen-Deficient glgC Mutant of Synechococcus sp. Strain PCC 7002.Appl Environ Microbiol. 2015 Sep;81(18):6210-22. doi: 10.1128/AEM.01751-15. Epub 2015 Jul 6. Appl Environ Microbiol. 2015. PMID: 26150450 Free PMC article.
-
Reciprocal regulation of photosynthesis and mitochondrial respiration by TOR kinase in Chlamydomonas reinhardtii.Plant Direct. 2019 Nov 14;3(11):e00184. doi: 10.1002/pld3.184. eCollection 2019 Nov. Plant Direct. 2019. PMID: 31832599 Free PMC article.
-
Evolutionary significance of an algal gene encoding an [FeFe]-hydrogenase with F-domain homology and hydrogenase activity in Chlorella variabilis NC64A.Planta. 2011 Oct;234(4):829-43. doi: 10.1007/s00425-011-1431-y. Epub 2011 Jun 5. Planta. 2011. PMID: 21643991
References
-
- Atsumi S., Higashide W., Liao J. C. 2009. Direct photosynthetic recycling of carbon dioxide to isobutyraldehyde. Nat. Biotechnol. 27:1177–1180 - PubMed
-
- Ball S. G. 1998. Regulation of starch biosynthesis, p. 549–567 InRochaix J.-D., Goldschmidt-Clermont M., Merchant S. (ed.), The molecular biology of chloroplasts and mitochondria in Chlamydomonas. Kluwer Academic Publishers, Dordrecht, Netherlands
-
- Ball S. G. 2002. The intricate pathway of starch biosynthesis and degradation in the monocellular alga Chlamydomonas reinhardtii. Aust. J. Chem. 55:49–59
-
- Ball S. G., Deschamps P. 2009. Starch metabolism, p. 1–40 InStern D. (ed.), The Chlamydomonas sourcebook, 2nd ed. Organellar and metabolic processes, vol. 2.Academic Press, Oxford, United Kingdom
Publication types
MeSH terms
Substances
LinkOut - more resources
Full Text Sources
Other Literature Sources
