

Metatranscriptome analysis of the human fecal microbiota reveals subject-specific expression profiles, with genes encoding proteins involved in carbohydrate metabolism being dominantly expressed
- PMID: 20562280
- PMCID: PMC2918960
- DOI: 10.1128/AEM.00502-10
Metatranscriptome analysis of the human fecal microbiota reveals subject-specific expression profiles, with genes encoding proteins involved in carbohydrate metabolism being dominantly expressed
Abstract
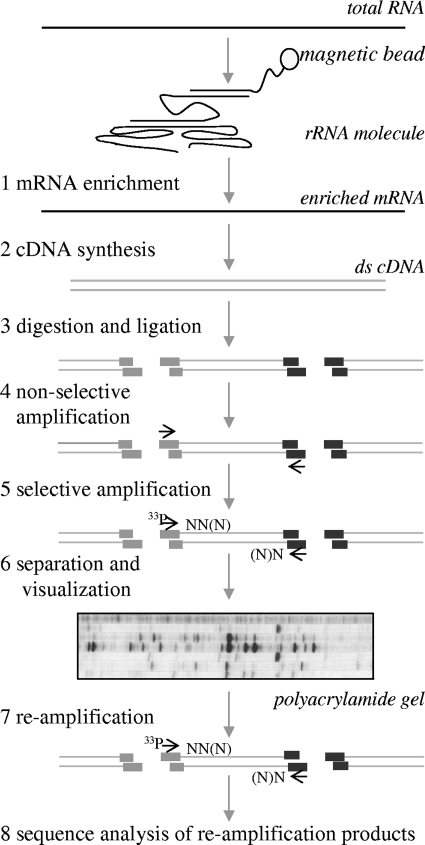
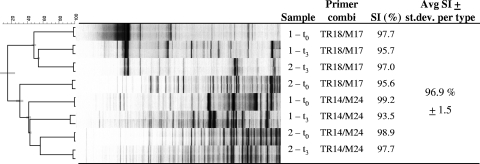
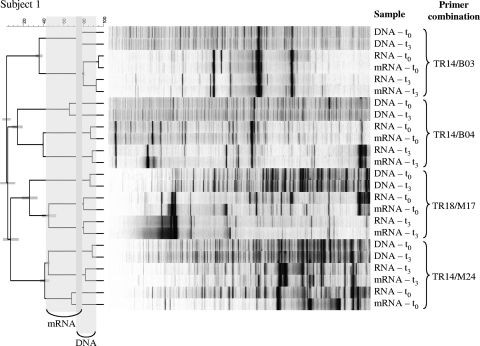
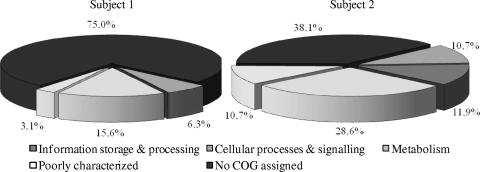
The human gastrointestinal (GI) tract provides home to a complex microbial community, collectively termed microbiota. Although major efforts have been made to describe the diversity and stability of the microbiota, functional studies have been largely restricted to intestinal isolates and include few community studies. The aim of this study was to explore the in situ gene expression of the fecal microbiota and to evaluate the RNA fingerprinting method cDNA-AFLP (cDNA amplified fragment length polymorphism) for this purpose. To this end, cDNA-AFLP analysis of enriched mRNA revealed that two healthy subjects showed highly divergent expression profiles with considerable fluctuations in time. Subsequent excision and sequence determination of bands from the mRNA-enriched profiles resulted in 122 identifiable sequences (transcripts and rRNAs). The classification of retrieved transcripts into functional clusters based on COG (cluster of orthologous genes) annotation showed that most assigned transcripts belonged to the metabolism cluster (26% of all sequences), underlining that even at the very end of the intestinal tract the microbiota is still very active. This study furthermore revealed that cDNA-AFLP is a useful tool to compare gene expression profiles in time in complex microbial communities.
Figures
References
-
- Altschul, S. F., W. Gish, W. Miller, E. W. Myers, and D. J. Lipman. 1990. Basic local alignment search tool. J. Mol. Biol. 215:403-410. - PubMed
-
- Asmann, Y. W., M. B. Wallace, and E. A. Thompson. 2008. Transcriptome profiling using next-generation sequencing. Gastroenterology 135:1466-1468. - PubMed
-
- Bachem, C. W., R. S. van der Hoeven, S. M. de Bruijn, D. Vreugdenhil, M. Zabeau, and R. G. Visser. 1996. Visualization of differential gene expression using a novel method of RNA fingerprinting based on AFLP: analysis of gene expression during potato tuber development. Plant J. 9:745-753. - PubMed
-
- Bachem, C. W. B., R. J. F. J. Oomen, and R. G. F. Visser. 1998. Transcript imaging with cDNA-AFLP: a step-by-step protocol. Plant Mol. Biol. Rep. 16:157-173.
Publication types
MeSH terms
Associated data
- Actions
- Actions
- Actions
- Actions
- Actions
- Actions
- Actions
- Actions
- Actions
- Actions
- Actions
- Actions
- Actions
- Actions
- Actions
- Actions
- Actions
- Actions
- Actions
- Actions
- Actions
- Actions
- Actions
- Actions
- Actions
- Actions
- Actions
- Actions
- Actions
- Actions
- Actions
- Actions
- Actions
- Actions
- Actions
- Actions
- Actions
- Actions
- Actions
- Actions
LinkOut - more resources
Full Text Sources
Other Literature Sources
Medical
Molecular Biology Databases
