

Requirement of purine and pyrimidine synthesis for colonization of the mouse intestine by Escherichia coli
- PMID: 20562286
- PMCID: PMC2916491
- DOI: 10.1128/AEM.00242-10
Requirement of purine and pyrimidine synthesis for colonization of the mouse intestine by Escherichia coli
Abstract
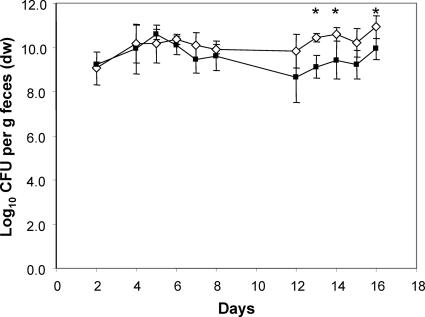
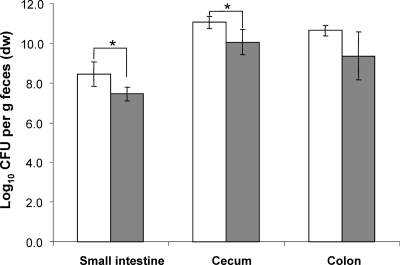
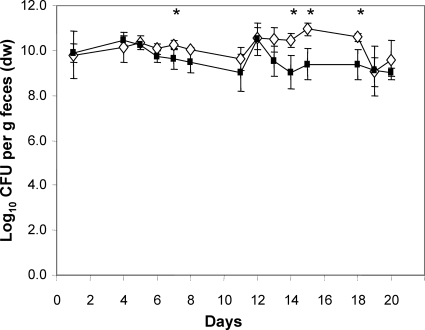
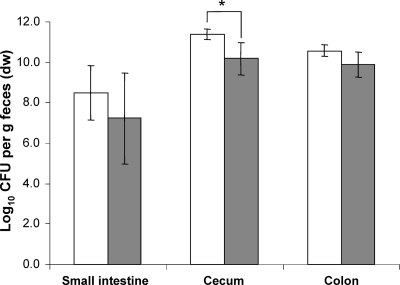
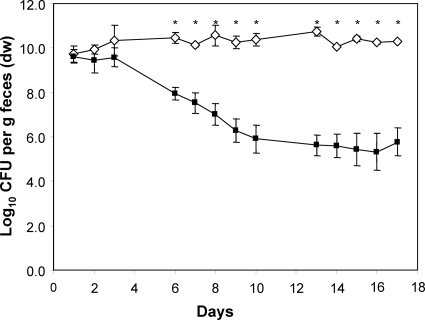
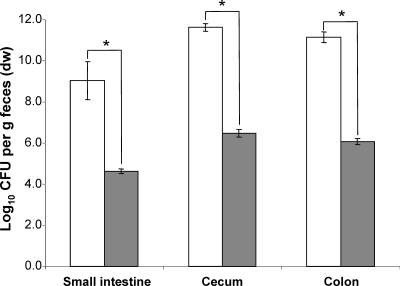
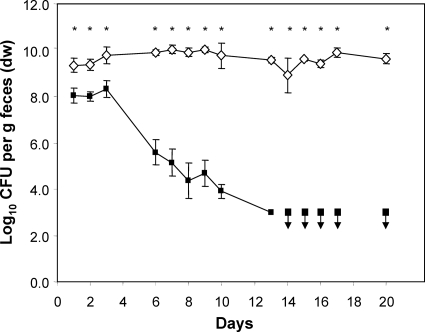
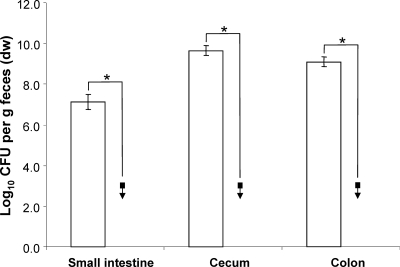
To study the adaptation of an intestinal bacterium to its natural environment, germfree mice were associated with commensal Escherichia coli MG1655. Two-dimensional gel electrophoresis was used to identify proteins differentially expressed in E. coli MG1655 collected from either cecal contents or anaerobic in vitro cultures. Fourteen differentially expressed proteins (>3-fold; P < 0.05) were identified, nine of which were upregulated in cecal versus in vitro-grown E. coli. Four of these proteins were investigated further for their role in gut colonization. After deletion of the corresponding genes, the resulting E. coli mutants were tested for their ability to colonize the intestines of gnotobiotic mice in competition with the wild-type strain. A mutant devoid of ydjG, which encodes a putative NADH-dependent methylglyoxal reductase, reached a 1.2-log-lower cecal concentration than the wild type. Deletion of the nanA gene encoding N-acetylneuraminate lyase affected the colonization and persistence of E. coli in the intestines of the gnotobiotic mice only slightly. A mutant devoid of 5'-phosphoribosyl 4-(N-succinocarboxamide)-5-aminoimidazole synthase, a key enzyme of purine synthesis, displayed intestinal cell counts >4 logs lower than those of the wild type. Deletion of the gene encoding aspartate carbamoyltransferase, a key enzyme of pyrimidine synthesis, even resulted in the washout of the corresponding mutant from the mouse intestinal tract. These findings indicate that E. coli needs to synthesize purines and pyrimidines to successfully colonize the mouse intestine.
Figures
Similar articles
-
Comparison of carbon nutrition for pathogenic and commensal Escherichia coli strains in the mouse intestine.Infect Immun. 2008 Mar;76(3):1143-52. doi: 10.1128/IAI.01386-07. Epub 2008 Jan 7. Infect Immun. 2008. PMID: 18180286 Free PMC article.
-
An Escherichia coli MG1655 lipopolysaccharide deep-rough core mutant grows and survives in mouse cecal mucus but fails to colonize the mouse large intestine.Infect Immun. 2003 Apr;71(4):2142-52. doi: 10.1128/IAI.71.4.2142-2152.2003. Infect Immun. 2003. PMID: 12654836 Free PMC article.
-
L-fucose stimulates utilization of D-ribose by Escherichia coli MG1655 DeltafucAO and E. coli Nissle 1917 DeltafucAO mutants in the mouse intestine and in M9 minimal medium.Infect Immun. 2007 Nov;75(11):5465-75. doi: 10.1128/IAI.00822-07. Epub 2007 Aug 20. Infect Immun. 2007. PMID: 17709419 Free PMC article.
-
F1C fimbriae play an important role in biofilm formation and intestinal colonization by the Escherichia coli commensal strain Nissle 1917.Appl Environ Microbiol. 2009 Jan;75(1):246-51. doi: 10.1128/AEM.01144-08. Epub 2008 Nov 7. Appl Environ Microbiol. 2009. PMID: 18997018 Free PMC article. Review.
-
Nutrition of Escherichia coli within the intestinal microbiome.EcoSal Plus. 2024 Dec 12;12(1):eesp00062023. doi: 10.1128/ecosalplus.esp-0006-2023. Epub 2024 Jan 11. EcoSal Plus. 2024. PMID: 38417452 Free PMC article. Review.
Cited by
-
Biological Containment of Genetically Modified Bacillus subtilis.Appl Environ Microbiol. 2018 Jan 17;84(3):e02334-17. doi: 10.1128/AEM.02334-17. Print 2018 Feb 1. Appl Environ Microbiol. 2018. PMID: 29150519 Free PMC article.
-
Regulation of the pyrimidine biosynthetic pathway by lysine acetylation of E. coli OPRTase.FEBS J. 2023 Jan;290(2):442-464. doi: 10.1111/febs.16598. Epub 2022 Sep 2. FEBS J. 2023. PMID: 35989594 Free PMC article.
-
Synthetic Gene Circuits Enable Systems-Level Biosensor Trigger Discovery at the Host-Microbe Interface.mSystems. 2019 Jun 11;4(4):e00125-19. doi: 10.1128/mSystems.00125-19. mSystems. 2019. PMID: 31186335 Free PMC article.
-
Iron Sequestration in Microbiota Biofilms As A Novel Strategy for Treating Inflammatory Bowel Disease.Inflamm Bowel Dis. 2018 Jun 8;24(7):1493-1502. doi: 10.1093/ibd/izy116. Inflamm Bowel Dis. 2018. PMID: 29788224 Free PMC article.
-
A thiouracil desulfurase protects Clostridioides difficile RNA from 4-thiouracil incorporation, providing a competitive advantage in the gut.Cell Host Microbe. 2025 Apr 9;33(4):573-588.e7. doi: 10.1016/j.chom.2025.03.001. Epub 2025 Mar 25. Cell Host Microbe. 2025. PMID: 40139192
References
-
- Alpert, C., W. Engst, A. Guehler, T. Oelschlaeger, and M. Blaut. 2005. Bacterial response to eukaryotic cells: Analysis of differentially expressed proteins using nano liquid chromatography-electrospray ionization tandem mass spectrometry. J. Chromatogr. A 1082:25-32. - PubMed
-
- Alpert, C., J. Scheel, W. Engst, G. Loh, and M. Blaut. 2009. Adaptation of protein expression by Escherichia coli in the gastrointestinal tract of gnotobiotic mice. Environ. Microbiol. 11:751-761. - PubMed
-
- Bartolomé, B., Y. Jubete, E. Martínez, and F. de la Cruz. 1991. Construction and properties of a family of pACYC184-derived cloning vectors compatible with pBR322 and its derivatives. Gene 102:75-78. - PubMed
-
- Czarnecka, J., M. Cieslak, and K. Michal. 2005. Application of solid phase extraction and high-performance liquid chromatography to qualitative and quantitative analysis of nucleotides and nucleosides in human cerebrospinal fluid. J. Chromatogr. B Analyt. Technol. Biomed. Life Sci. 822:85-90. - PubMed
Publication types
MeSH terms
Substances
LinkOut - more resources
Full Text Sources
Molecular Biology Databases
