. 2010 Jul 6;107(27):12399-404.
doi: 10.1073/pnas.0908278107. Epub 2010 Jun 18.

Self-organization of the phosphatidylinositol lipids signaling system for random cell migration

Affiliations

Self-organization of the phosphatidylinositol lipids signaling system for random cell migration

Yoshiyuki Arai et al. Proc Natl Acad Sci U S A. .

Abstract

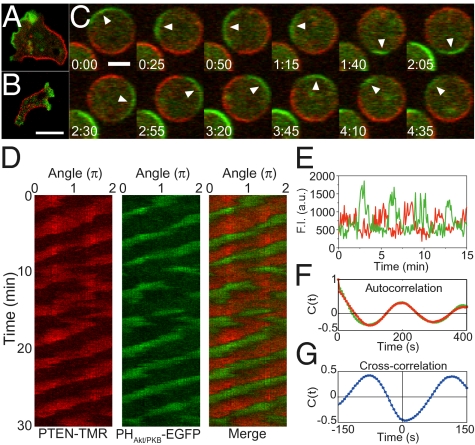
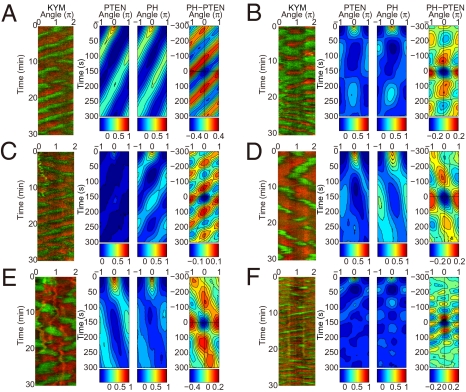
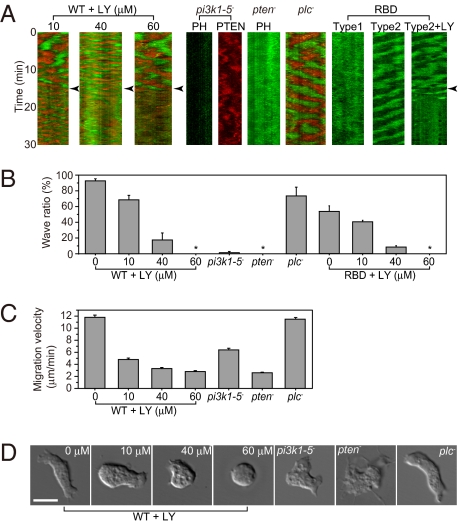
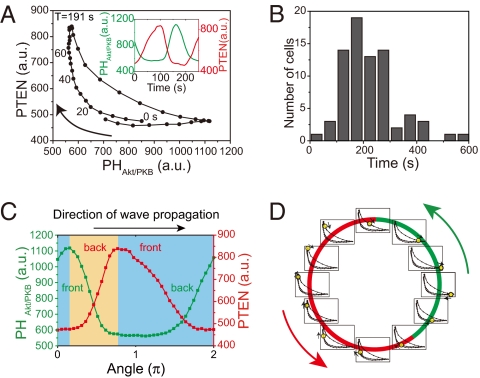
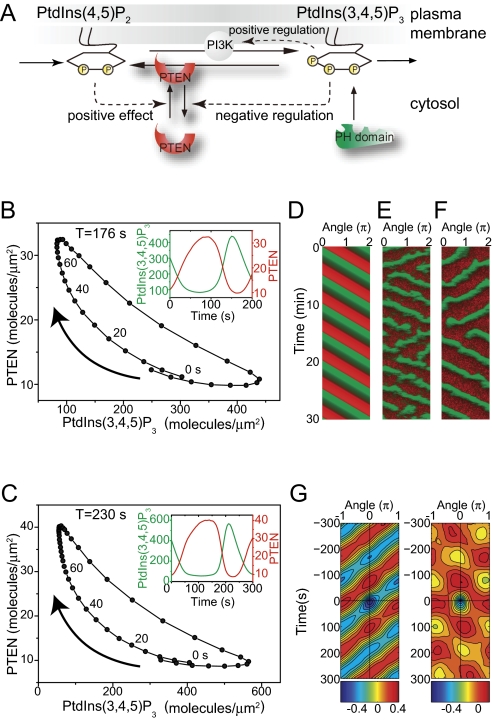
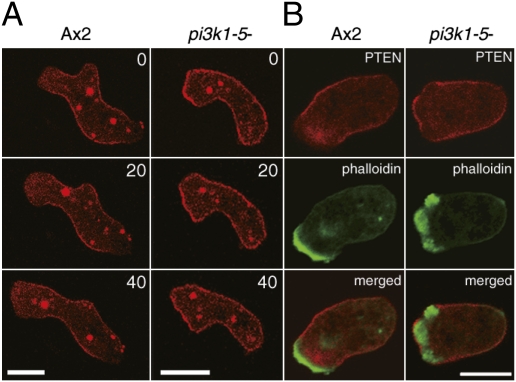
Phosphatidylinositol (PtdIns) lipids have been identified as key signaling mediators for random cell migration as well as chemoattractant-induced directional migration. However, how the PtdIns lipids are organized spatiotemporally to regulate cellular motility and polarity remains to be clarified. Here, we found that self-organized waves of PtdIns 3,4,5-trisphosphate [PtdIns(3,4,5)P(3)] are generated spontaneously on the membrane of Dictyostelium cells in the absence of a chemoattractant. Characteristic oscillatory dynamics within the PtdIns lipids signaling system were determined experimentally by observing the phenotypic variability of PtdIns lipid waves in single cells, which exhibited characteristics of a relaxation oscillator. The enzymes phosphatase and tensin homolog (PTEN) and phosphoinositide-3-kinase (PI3K), which are regulators for PtdIns lipid concentrations along the membrane, were essential for wave generation whereas functional actin cytoskeleton was not. Defects in these enzymes inhibited wave generation as well as actin-based polarization and cell migration. On the basis of these experimental results, we developed a reaction-diffusion model that reproduced the characteristic relaxation oscillation dynamics of the PtdIns lipid system, illustrating that a self-organization mechanism provides the basis for the PtdIns lipids signaling system to generate spontaneous spatiotemporal signals for random cell migration and that molecular noise derived from stochastic fluctuations within the signaling components gives rise to the variability of these spontaneous signals.


Conflict of interest statement

The authors declare no conflict of interest.

Figures

Fig. 1.
Fig. 1.
Self-organized traveling waves of PHAkt/PKB and PTEN. (A and B) Fluorescent image of Dictyostelium discoideum cells expressing PTEN-TMR (red) and PHAkt/PKB-EGFP (green) (A) and cells expressing PTEN-TMR (red) and PI3K2-EGFP (green) (B). Both PHAkt/PKB-EGFP and PI3K2-EGFP were localized at the pseudopod regions. PTEN-TMR was localized at the lateral and tail regions of migrating cells. (Scale bar, 10 μm.) (C) Time-lapse images of a cell treated with 5 μM latrunculin A. Arrowheads indicate a PHAkt/PKB- enriched domain on the membrane. Time, min:s. (Scale bar, 5 μm.) (D) Kymograph of PTEN-TMR and PHAkt/PKB-EGFP showing traveling waves while maintaining reciprocal localization. (E) Time trajectories of fluorescence intensities of PTEN-TMR (red) and PHAkt/PKB-EGFP (green) on a subdomain of the membrane. (F) Temporal autocorrelation function for the PTEN-TMR (red) and PHAkt/PKB-EGFP (green) shown in D. (G) Temporal cross-correlation function between PTEN-TMR and PHAkt/PKB-EGFP.
Fig. 2.
Fig. 2.
Various ordered patterns of PHAkt/PKB and PTEN. (A–F) Gallery of kymographs of PHAkt/PKB-EGFP and PTEN-TMR (Left, KYM). Each kymograph corresponds to different single cells. Developed cells (A–D) and vegetative cells in the absence (E) or the presence (F) of 4 mM caffeine are shown. Each cell shows different patterns despite the same experimental conditions. The corresponding spatiotemporal autocorrelation of PTEN-TMR (PTEN) and PHAkt/PKB-EGFP (PH) and the spatiotemporal cross-correlation between PHAkt/PKB-EGFP and PTEN-TMR (Right, PH-PTEN), plotted as a function of time and angle differences, are shown. Intensities are explained below each kymograph.
Fig. 3.
Fig. 3.
Involvement of PI3K and PTEN in signal generation for cell polarization and migration. (A) PHAkt/PKB-EGFP and/or PTEN-TMR dynamics in cells in the presence of latrunculin A and an inhibited PtdIns lipids system. At the time points indicated by the arrowheads, wild-type cells were treated with LY294002 (+LY). pi3k1-5-null (pi3k1-5), pten-null (pten), and plc-null (plc) cells were also examined. GFP-RBD was observed in wild-type cells. (B) Summary of the self-organized wave inhibition. From left to right: wild-type cells (95 cells, n = 16) at 10 μM (136 cells, n = 4), 40 μM (119 cells, n = 3), and 60 μM (78 cells, n = 8) LY294002; pi3k1-5-null cells (60 cells, n = 5), pten-null cells (55 cells, n = 6), and plc-null cells (82 cells, n = 4); and RBD wave (121 cells, n = 10) at 10 μM (84 cells, n = 6), 40 μM (47 cells, n = 3), and 60 μM (51 cells, n = 3) LY294002. Data are mean ± SEM; n, number of independent experiments; *, no waves. (C) Migration velocity of the cells: wild type (n = 157), at 10 μM (n = 150), 40 μM (n = 174), and 60 μM (n = 137) LY294002; and pi3k1-5-null (n = 103), pten-null (n = 109), and plc-null (n = 104). Data are mean ± SEM; n, number of cells. (D) Cell shapes observed in the absence of latrunculin A. (Scale bar, 10 μm.)
Fig. 4.
Fig. 4.
Dynamics of the PtdIns lipid system. (A) Averaged temporal evolution dynamics of PTEN-TMR and PHAkt/PKB-EGFP obtained by principal components analysis of the traveling waves observed in the cell shown in Fig. 1. (Inset) Time trajectories of the averaged dynamics of PTEN-TMR (red) and PHAkt/PKB-EGFP (green). (B) Histograms of the oscillation periods obtained by principal components analysis of the traveling waves (n = 75 cells). (C) Spatial profiles of PTEN-TMR (red) and PHAkt/PKB-EGFP (green) along the membrane (0–2π) at a given time. The upper and lower branches of the averaged time evolution dynamics shown correspond to profiles in the yellow and blue areas, respectively. (D) Schematic illustration of wave propagation. Spatial profiles of PHAkt/PKB [PtdIns(3,4,5)P3] and PTEN are indicated as green and red bars along the membrane, respectively. At individual local regions on the membrane, the PtdIns lipid system undergoes dynamical changes in [PHAkt/PKB] and [PTEN] in accordance with the averaged oscillatory dynamics shown in A. The phases of the oscillation at individual local regions are indicated by yellow dots on the crescent-shaped traces. Arrows indicate the wave propagation direction.
Fig. 5.
Fig. 5.
Mathematical model of PtdIns lipid traveling waves. (A) Scheme of reactions. PTEN recruitment to the membrane is negatively regulated by PtdIns(3,4,5)P3, a relationship crucial for reproducing the traveling waves observed experimentally. (B and C) Crescent-shaped dynamics of PtdIns lipids traveling waves constructed from the time series of the stochastic simulation using the same analysis performed on the experimental data. (Insets) Trajectories of the reconstructed dynamics showing reciprocal changes between PTEN and PtdIns(3,4,5)P3, irrespective of whether the Ras-PI3K-PtdIns(3,4,5)P3 positive feedback loop is included (C) or not (B) in the model. (D–F) Reproduced traveling waves of PTEN (red) and PtdIns(3,4,5)P3 (green) represented as a kymograph. Results were obtained by a deterministic simulation using a set of partial differential equations (D) or stochastic simulations (E and F) (SI Text, Table S1). The stochastic simulations were performed in the model with (F) or without (E) the feedback loop. (G) Phenotypic variability was reproduced by including stochastic noise in the model. The spatiotemporal cross-correlation function of ordered patterns between PtdIns(3,4,5)P3 and PTEN obtained from the stochastic simulation shows a traveling wave (Left) and spatiotemporal oscillation (Right).
Fig. 6.
Fig. 6.
Requirement of PtdIns(3,4,5)P3 for PTEN exclusion from the leading edge of migrating cells. (A) PTEN localization in wild-type (Left) and pi3k1-5-null (Right) cells. Numbers in the upper right of each panel are time in seconds. (Scale bar, 10 μm.) (B) Simultaneous imaging of PTEN and F-actin localization in wild-type (Left) and pi3k1-5-null (Right) cells. Images of PTEN-TMR (Top) and Alexa488-phalloidin (Middle) were obtained from the same cell and superimposed (Bottom). (Scale bar, 10 μm.)

References

    1. Oosawa F. Spontaneous signal generation in living cells. Bull Math Biol. 2001;63:643–654. - PubMed
    1. Berg HC, Brown DA. Chemotaxis in Escherichia coli analysed by three-dimensional tracking. Nature. 1972;239:500–504. - PubMed
    1. Sasaki AT, et al. G protein-independent Ras/PI3K/F-actin circuit regulates basic cell motility. J Cell Biol. 2007;178:185–191. - PMC - PubMed
    1. Takagi H, Sato MJ, Yanagida T, Ueda M. Functional analysis of spontaneous cell movement under different physiological conditions. PLoS ONE. 2008;3:e2648. - PMC - PubMed
    1. Shibata T, Fujimoto K. Noisy signal amplification in ultrasensitive signal transduction. Proc Natl Acad Sci USA. 2005;102:331–336. - PMC - PubMed

MeSH terms