

Biochemical characterization of the cell-biomaterial interface by quantitative proteomics
- PMID: 20562470
- PMCID: PMC2953907
- DOI: 10.1074/mcp.M110.001966
Biochemical characterization of the cell-biomaterial interface by quantitative proteomics
Abstract
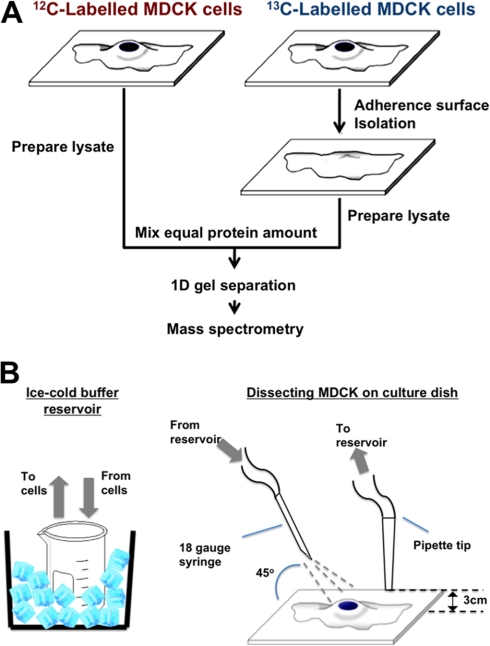
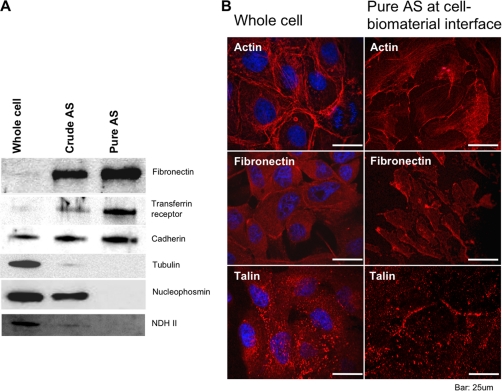
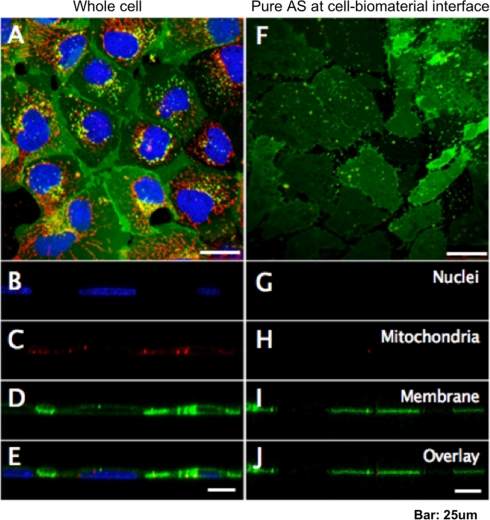
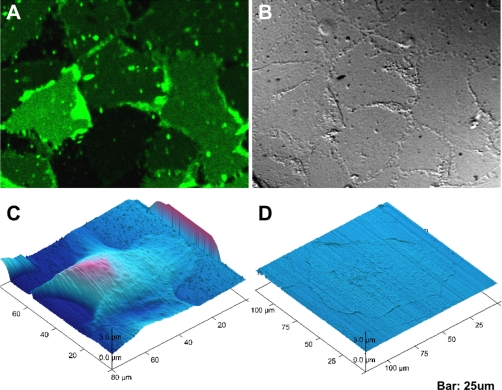
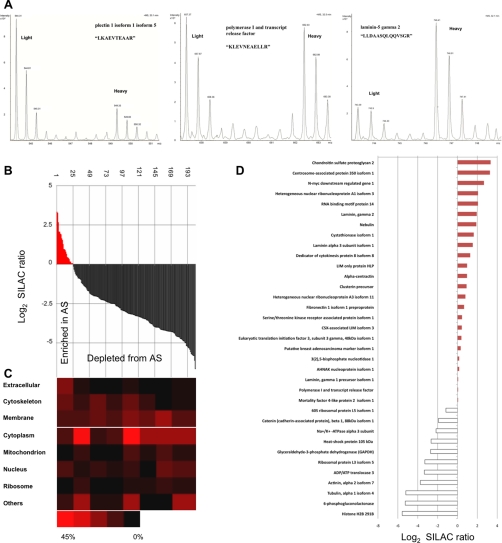
Surface topography and texture of cell culture substrata can affect the differentiation and growth of adherent cells. The biochemical basis of the transduction of the physical and mechanical signals to cellular responses is not well understood. The lack of a systematic characterization of cell-biomaterial interaction is the major bottleneck. This study demonstrated the use of a novel subcellular fractionation method combined with quantitative MS-based proteomics to enable the robust and high-throughput analysis of proteins at the adherence interface of Madin-Darby canine kidney cells. This method revealed the enrichment of extracellular matrix proteins and membrane and stress fibers proteins at the adherence surface, whereas it shows depletion of extracellular matrix belonging to the cytoplasmic, nucleus, and lateral and apical membranes. The asymmetric distribution of proteins between apical and adherence sides was also profiled. Apart from classical proteins with clear involvement in cell-material interactions, proteins previously not known to be involved in cell attachment were also discovered.
Figures
Similar articles
-
Proteomics profiling of Madin-Darby canine kidney plasma membranes reveals Wnt-5a involvement during oncogenic H-Ras/TGF-beta-mediated epithelial-mesenchymal transition.Mol Cell Proteomics. 2011 Feb;10(2):M110.001131. doi: 10.1074/mcp.M110.001131. Epub 2010 May 28. Mol Cell Proteomics. 2011. PMID: 20511395 Free PMC article.
-
Quantitative proteomics of MDCK cells identify unrecognized roles of clathrin adaptor AP-1 in polarized distribution of surface proteins.Proc Natl Acad Sci U S A. 2019 Jun 11;116(24):11796-11805. doi: 10.1073/pnas.1821076116. Epub 2019 May 29. Proc Natl Acad Sci U S A. 2019. PMID: 31142645 Free PMC article.
-
Biomaterial surface proteomic signature determines interaction with epithelial cells.Acta Biomater. 2017 May;54:150-163. doi: 10.1016/j.actbio.2017.02.044. Epub 2017 Mar 1. Acta Biomater. 2017. PMID: 28259836
-
Spatial perspectives in the redox code-Mass spectrometric proteomics studies of moonlighting proteins.Mass Spectrom Rev. 2018 Jan;37(1):81-100. doi: 10.1002/mas.21508. Epub 2016 May 17. Mass Spectrom Rev. 2018. PMID: 27186965 Review.
-
Functional proteomics of cellular mechanosensing mechanisms.Semin Cell Dev Biol. 2017 Nov;71:118-128. doi: 10.1016/j.semcdb.2017.06.019. Epub 2017 Jul 1. Semin Cell Dev Biol. 2017. PMID: 28676425 Review.
Cited by
-
Alpha-catenin-dependent recruitment of the centrosomal protein CAP350 to adherens junctions allows epithelial cells to acquire a columnar shape.PLoS Biol. 2015 Mar 12;13(3):e1002087. doi: 10.1371/journal.pbio.1002087. eCollection 2015 Mar. PLoS Biol. 2015. PMID: 25764135 Free PMC article.
-
Approaches to studying Arf GAPs in cells: in vitro assay with isolated focal adhesions.Curr Protoc Cell Biol. 2012 Jun;Chapter 17:17.13.1-17.13.20. doi: 10.1002/0471143030.cb1713s55. Curr Protoc Cell Biol. 2012. PMID: 23129116 Free PMC article. Review.
-
ARAP2 signals through Arf6 and Rac1 to control focal adhesion morphology.J Biol Chem. 2013 Feb 22;288(8):5849-60. doi: 10.1074/jbc.M112.415778. Epub 2013 Jan 7. J Biol Chem. 2013. PMID: 23295182 Free PMC article.
-
Development of a human extracellular matrix for applications related with stem cells and tissue engineering.Stem Cell Rev Rep. 2012 Mar;8(1):170-83. doi: 10.1007/s12015-011-9270-6. Stem Cell Rev Rep. 2012. PMID: 21710145 Free PMC article. No abstract available.
-
Haralick's texture analysis to predict cellular proliferation on randomly oriented electrospun nanomaterials.Nanoscale Adv. 2022 Feb 16;4(5):1330-1335. doi: 10.1039/d1na00890k. eCollection 2022 Mar 1. Nanoscale Adv. 2022. PMID: 36133676 Free PMC article.
References
-
- Saito T., Hayashi H., Kameyama T., Hishida M., Nagai K., Teraoka K., Kato K. (2010) Suppressed proliferation of mouse osteoblast-like cells by a rough-surfaced substrate leads to low differentiation and mineralization. Materials Sci. Engineer. C 30, 1–7
-
- Bigerelle M., Anselme K., NoÎl B., Ruderman I., Hardouin P., Iost A. (2002) Improvement in the morphology of Ti-based surfaces: a new process to increase in vitro human osteoblast response. Biomaterials 23, 1563–1577 - PubMed
-
- Mendonca G., Mendonca D. B., Simoes L. G., Araujo A. L., Leite E. R., Duarte W. R., Aragao F. J., Cooper L. F. (2009) The effects of implant surface nanoscale features on osteoblast-specific gene expression. Biomaterials 30, 4053–4062 - PubMed
-
- Lam M. T., Huang Y.-C., Birla R. K., Takayama S. (2009) Microfeature guided skeletal muscle tissue engineering for highly organized 3-dimensional free-standing constructs. Biomaterials 30, 1150–1155 - PubMed
MeSH terms
Substances
LinkOut - more resources
Full Text Sources
Molecular Biology Databases
