

CD90/THY1 is overexpressed in prostate cancer-associated fibroblasts and could serve as a cancer biomarker
- PMID: 20562849
- PMCID: PMC2948633
- DOI: 10.1038/modpathol.2010.122
CD90/THY1 is overexpressed in prostate cancer-associated fibroblasts and could serve as a cancer biomarker
Abstract
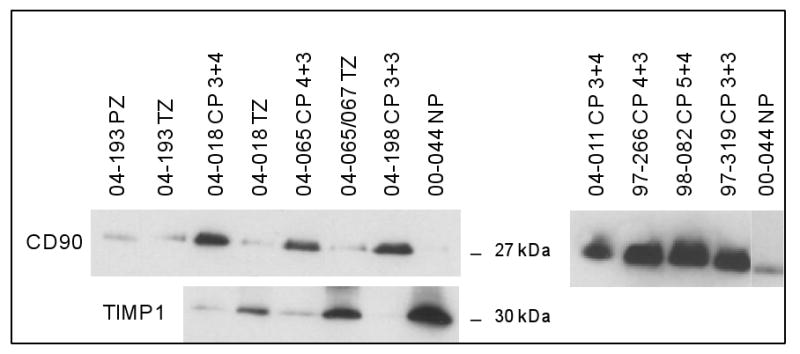
A by-product in the processing of prostate tissue for cell sorting by collagenase digestion is the media supernatant that remains after the cells are harvested. These supernatants contain proteins made by the cells within the tissue. Quantitative proteomic analysis of N-glycosylated proteins detected an increased amount of CD90/THY1 in cancer supernatants compared with non-cancer supernatants. Immunohistochemistry showed that in all carcinomas, regardless of Gleason grade, a layer of CD90-positive stromal fibroblastic cells, ∼5 to 10 cells deep, was localized to tumor glands. In contrast, a no more than 1-cell wide girth of CD90-positive stromal cells was found around benign glands. The increased number of CD90-positive stromal cells in cancer correlated with overexpression of CD90 mRNA detected by gene expression analysis of stromal cells obtained by laser-capture microdissection. There is increasing evidence that cancer-associated stroma has a function in both tumor progression and carcinogenesis. Most experiments to identify cancer biomarkers have focused on the cancer cells. CD90, being a marker for prostate cancer-associated stroma, might be a potential biomarker for this cancer. A non-invasive test could be provided by a urine test. Proteomic analysis of urine from patients with prostate cancer identified CD90; conversely, CD90 was not detected in the urine of post-prostatectomy patients. Furthermore, this urinary CD90 protein was a variant CD90 protein not known to be expressed by such cells as lymphocytes that express CD90. These CD90 results were obtained from ∼90 cases consisting of proteomic analysis of tissue and urine, immunohistochemistry, western blot analysis of tissue media, flow cytometry of cells from digested tissue, and reverse transcriptase polymerase chain reaction analysis of isolated stromal cells.
Conflict of interest statement
The authors declare no conflict of interest.
Figures


Similar articles
-
Tumor-promoting phenotype of CD90hi prostate cancer-associated fibroblasts.Prostate. 2009 Jun 15;69(9):991-1000. doi: 10.1002/pros.20946. Prostate. 2009. PMID: 19267366 Free PMC article.
-
Dicarbonyl/L-xylulose reductase: a potential biomarker identified by laser-capture microdissection-micro serial analysis of gene expression of human prostate adenocarcinoma.Cancer Epidemiol Biomarkers Prev. 2007 Dec;16(12):2615-22. doi: 10.1158/1055-9965.EPI-07-0684. Cancer Epidemiol Biomarkers Prev. 2007. PMID: 18086765
-
Asporin is a stromally expressed marker associated with prostate cancer progression.Br J Cancer. 2017 Mar 14;116(6):775-784. doi: 10.1038/bjc.2017.15. Epub 2017 Feb 2. Br J Cancer. 2017. PMID: 28152543 Free PMC article.
-
Analysis of gene expression in prostate cancer epithelial and interstitial stromal cells using laser capture microdissection.BMC Cancer. 2010 Apr 28;10:165. doi: 10.1186/1471-2407-10-165. BMC Cancer. 2010. PMID: 20426842 Free PMC article.
-
Multiple roles of CD90 in cancer.Tumour Biol. 2016 Sep;37(9):11611-11622. doi: 10.1007/s13277-016-5112-0. Epub 2016 Jun 23. Tumour Biol. 2016. PMID: 27337957 Review.
Cited by
-
Role and mechanism of CD90+ fibroblasts in inflammatory diseases and malignant tumors.Mol Med. 2023 Feb 6;29(1):20. doi: 10.1186/s10020-023-00616-7. Mol Med. 2023. PMID: 36747131 Free PMC article. Review.
-
Approaches to the discovery of non-invasive urinary biomarkers of prostate cancer.Oncotarget. 2018 Aug 21;9(65):32534-32550. doi: 10.18632/oncotarget.25946. eCollection 2018 Aug 21. Oncotarget. 2018. PMID: 30197761 Free PMC article. Review.
-
Biological heterogeneity and versatility of cancer-associated fibroblasts in the tumor microenvironment.Oncogene. 2019 Jun;38(25):4887-4901. doi: 10.1038/s41388-019-0765-y. Epub 2019 Feb 28. Oncogene. 2019. PMID: 30816343 Review.
-
Identification of tumor-agnostic biomarkers for predicting prostate cancer progression and biochemical recurrence.Front Oncol. 2023 Oct 26;13:1280943. doi: 10.3389/fonc.2023.1280943. eCollection 2023. Front Oncol. 2023. PMID: 37965470 Free PMC article.
-
Prostate cancer research: tools, cell types, and molecular targets.Front Oncol. 2024 Mar 26;14:1321694. doi: 10.3389/fonc.2024.1321694. eCollection 2024. Front Oncol. 2024. PMID: 38595814 Free PMC article. Review.
References
-
- Cunha GR, Ricke W, Thomson A, et al. Hormonal, cellular, and molecular regulation of normal and neoplastic prostatic development. J Steroid Biochem Mol Biol. 2004;92:221–236. - PubMed
-
- Sung SY, Chung LW. Prostate tumor-stroma interaction: molecular mechanisms and opportunities for therapeutic targeting. Differentiation. 2002;70:506–521. - PubMed
-
- Zhang H, Li XJ, Martin DB, et al. Identification and quantification of N-linked glycoproteins using hydrazide chemistry, stable isotope labeling and mass spectrometry. Nat Biotechnol. 2003;21:660–666. - PubMed
Publication types
MeSH terms
Substances
Grants and funding
LinkOut - more resources
Full Text Sources
Other Literature Sources
Medical
Miscellaneous
