

Common SNPs explain a large proportion of the heritability for human height
- PMID: 20562875
- PMCID: PMC3232052
- DOI: 10.1038/ng.608
Common SNPs explain a large proportion of the heritability for human height
Abstract
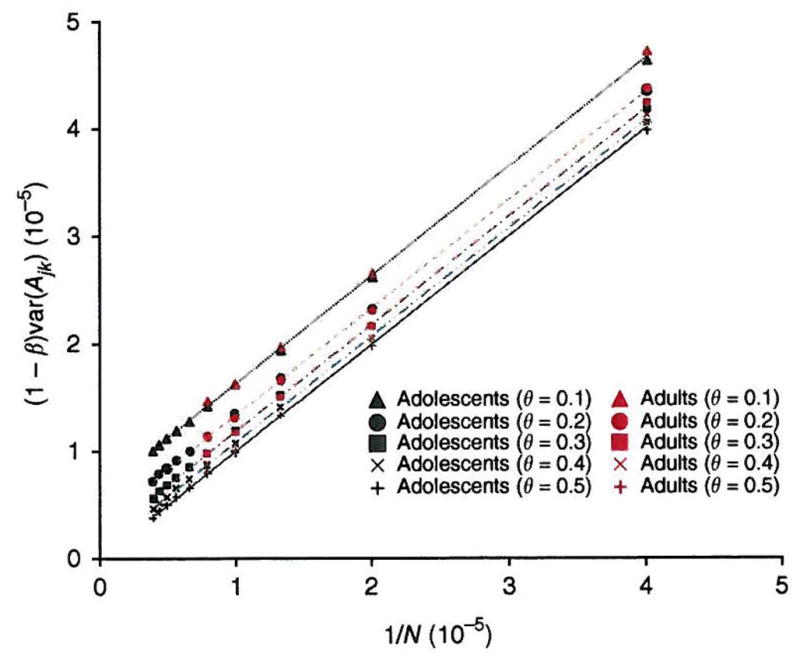
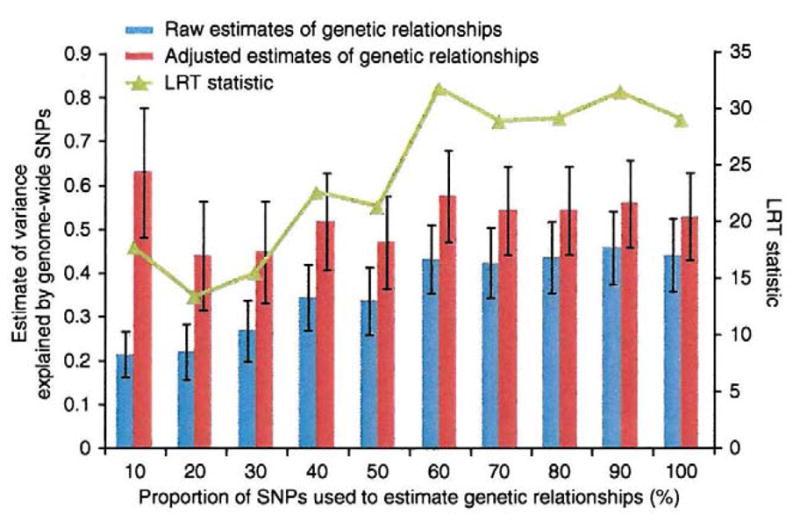
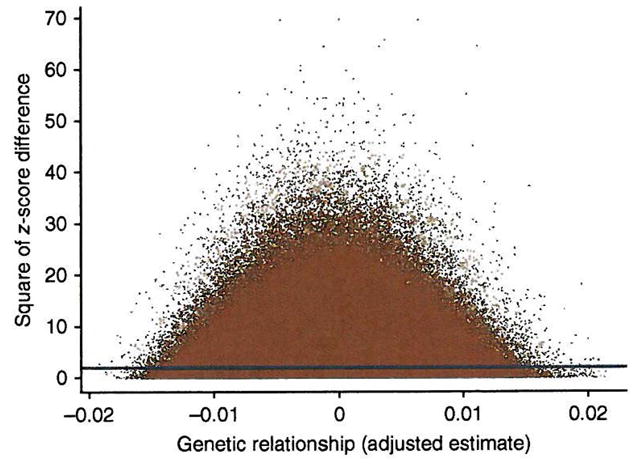
SNPs discovered by genome-wide association studies (GWASs) account for only a small fraction of the genetic variation of complex traits in human populations. Where is the remaining heritability? We estimated the proportion of variance for human height explained by 294,831 SNPs genotyped on 3,925 unrelated individuals using a linear model analysis, and validated the estimation method with simulations based on the observed genotype data. We show that 45% of variance can be explained by considering all SNPs simultaneously. Thus, most of the heritability is not missing but has not previously been detected because the individual effects are too small to pass stringent significance tests. We provide evidence that the remaining heritability is due to incomplete linkage disequilibrium between causal variants and genotyped SNPs, exacerbated by causal variants having lower minor allele frequency than the SNPs explored to date.
Figures
Comment in
-
A commentary on 'common SNPs explain a large proportion of the heritability for human height' by Yang et al. (2010).Twin Res Hum Genet. 2010 Dec;13(6):517-24. doi: 10.1375/twin.13.6.517. Twin Res Hum Genet. 2010. PMID: 21142928
References
-
- Donnelly P. Progress and challenges in genome-wide association studies in humans. Nature. 2008;456:728–31. - PubMed
-
- Maher B. Personal genomes: The case of the missing heritability. Nature. 2008;456:18–21. - PubMed
-
- Frazer KA, Murray SS, Schork NJ, Topol EJ. Human genetic variation and its contribution to complex traits. Nat Rev Genet. 2009;10:241–51. - PubMed
Publication types
MeSH terms
Grants and funding
- R01 AA007535/AA/NIAAA NIH HHS/United States
- R01 AA014041/AA/NIAAA NIH HHS/United States
- AA13320/AA/NIAAA NIH HHS/United States
- DA12854/DA/NIDA NIH HHS/United States
- R01 AA013321/AA/NIAAA NIH HHS/United States
- R01 DA012854/DA/NIDA NIH HHS/United States
- AA13326/AA/NIAAA NIH HHS/United States
- R01 AA013320/AA/NIAAA NIH HHS/United States
- AA13321/AA/NIAAA NIH HHS/United States
- AA10248/AA/NIAAA NIH HHS/United States
- R01 AA013326/AA/NIAAA NIH HHS/United States
- R56 DA012854/DA/NIDA NIH HHS/United States
- AA014041/AA/NIAAA NIH HHS/United States
- R01 AA010249/AA/NIAAA NIH HHS/United States
LinkOut - more resources
Full Text Sources
Other Literature Sources
