. 2010 Jun;12(6):453-63.
doi: 10.1593/neo.10126.

Invasive glioblastoma cells acquire stemness and increased Akt activation

Affiliations

Invasive glioblastoma cells acquire stemness and increased Akt activation

Jennifer R Molina et al. Neoplasia. 2010 Jun.

Abstract

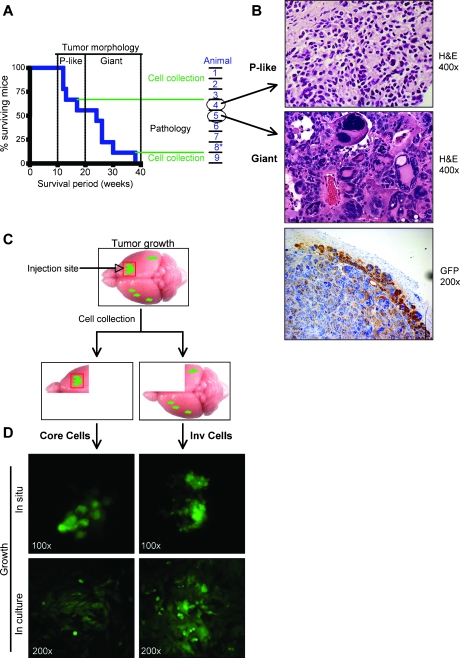
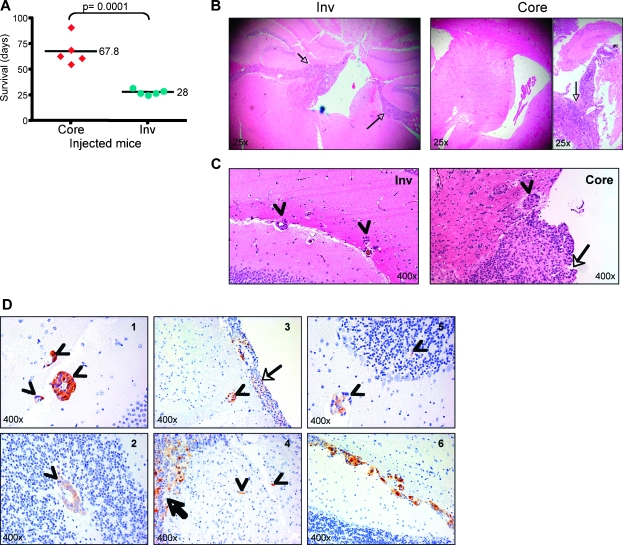
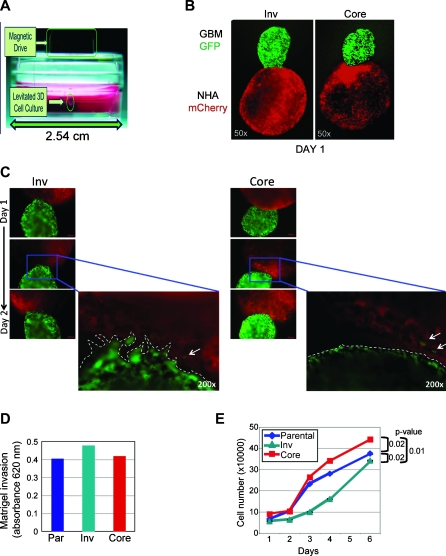
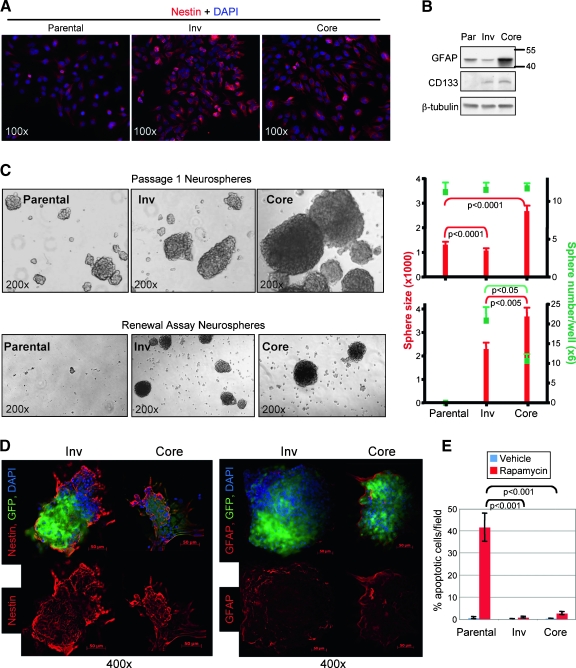
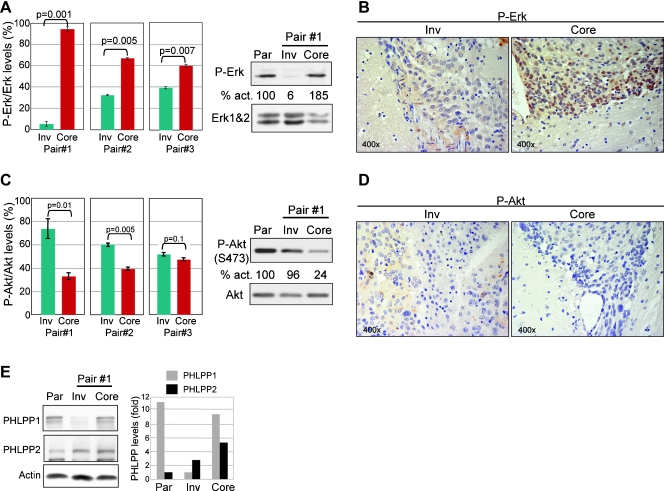
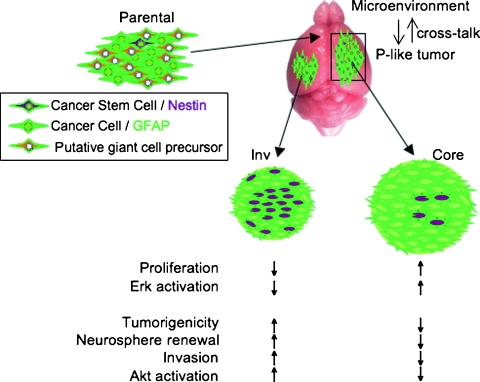
Glioblastoma multiforme (GBM) is the most frequent and most aggressive brain tumor in adults. The dismal prognosis is due to postsurgery recurrences arising from escaped invasive tumor cells. The signaling pathways activated in invasive cells are under investigation, and models are currently designed in search for therapeutic targets. We developed here an in vivo model of human invasive GBM in mouse brain from a GBM cell line with moderate tumorigenicity that allowed simultaneous primary tumor growth and dispersal of tumor cells in the brain parenchyma. This strategy allowed for the first time the isolation and characterization of matched sets of tumor mass (Core) and invasive (Inv) cells. Both cell populations, but more markedly Inv cells, acquired stem cell markers, neurosphere renewal ability, and resistance to rapamycin-induced apoptosis relative to parental cells. The comparative phenotypic analysis between Inv and Core cells showed significantly increased tumorigenicity in vivo and increased invasion with decreased proliferation in vitro for Inv cells. Examination of a large array of signaling pathways revealed extracellular signal-regulated kinase (Erk) down-modulation and Akt activation in Inv cells and an opposite profile in Core cells. Akt activation correlated with the increased tumorigenicity, stemness, and invasiveness, whereas Erk activation correlated with the proliferation of the cells. These results underscore complementary roles of the Erk and Akt pathways for GBM proliferation and dispersal and raise important implications for a concurrent inhibitory therapy.


Figures

Figure 1
Figure 1
Isolation of invasive (Inv) GBM cells in vivo. (A) Kaplan-Meier survival curve of SCID mice (n = 9) inoculated intracranially with GFP-labeled parental U251-MG cells. The biphasic mouse survival pattern segregates tumor morphology into parental (P)-like (survival < 20 weeks) or giant cell (survival > 20 weeks) except for animal 8* that developed P-like tumor. On the right, the processing route of the isolated brains is indicated. (B) H&E staining showing the two tumor morphologies identified from the animals circled in (A). The IHC with anti-GFP antibody confirms the U251 origin of the giant multinucleated cells. (C) Procedure scheme: the upper panel depicts a mouse brain and the site of injection of GFP-labeled parental cells (red square). The right front quadrant containing the core of the tumor (right panel) and the remaining three quadrants containing invasive cells (left panel) were processed separately for isolation of pairs of Core and Inv cells, respectively. (D) Fluorescent visualization of the two GFP-labeled cell populations growing in situ, in the brain of mice (upper panels), and after isolation in culture (lower panels).
Figure 2
Figure 2
Inv cells are more tumorigenic in vivo than Core cells. (A) Survival of mice inoculated with the three pairs of Core and Inv cells isolated from the brains of the mice 1, 2, and 3 shown in Figure 1A. Survival periods are expressed as individual values distributed around the mean. (B) H&E showing gross morphology of the brain (original magnification, x25). Note infiltration with Inv cells of ependyma and meninges (arrows) with marked dilatation of the third ventricle. Note also bulky detached tumors (arrow) of Core cells without infiltration of the ventricles (left panel). (C) H&E showing infiltration of the brain parenchyma by cells detached from the main tumor mass in mice inoculated with either Core or Inv cells. Arrows indicate the main tumor mass; arrowheads, the infiltrative cells. (D) Patterns of migration of Inv cells in the brain of mice. IHC with GFP antibody distinguishes the tumor cells from the normal parenchyma. Arrows indicate the tumor mass; arrowheads, infiltrative cells. Note several patterns of migration: in clusters surrounding blood vessels (satellitosis), in the white matter (1 and 5), the gray matter (2), or in the white matter tracts (3); migration as separate cells (4 and 5); and migration as trains of cells along the white matter tracts (6).
Figure 3
Figure 3
In vivo-selected Inv cells demonstrate increased invasion and decreased proliferation relative to Core cells. (A) Three-dimensional in vitro invasion assay setup: the GBM or NHA cells treated with Au-Phage-FeO (Levitated 3D Cell Culture) were held in suspension by the magnetic field of a magnet attached to the top of the tissue culture plate (Magnetic Drive). (B) Three-dimensional spheres were allowed to form separately from GFP-labeled Inv and Core cells and from mCherry-labeled NHAs and magnetically guided together. (C) Serial fluorescence images for 48 hours of GBM-NHA composites show an invading front of Inv cells at the contact area with NHAs (dotted line) in contrast to the unaltered surface maintained by Core cells in contact with NHAs. (D) Matrigel invasion assay showing increased invasion of Inv cells compared with parental (Par) or Core cells. (E) MTT proliferation assay of U251-MG parental, Inv, and Core cells shows higher proliferation of Core cells. Data are means ± SEM from triplicates. P values were computed by using paired t test. These experiments were repeated three times with similar results.
Figure 4
Figure 4
Invasive cells show stem cell characteristics. (A) Immunofluorescence with nestin antibody shows increased staining in Inv cells. (B) Immunoblot analysis with indicated antibodies of protein extracts from U251-MG parental (Par), Inv, and Core cells shows increased GFAP expression in Core cells and gain of CD133 expression in both subpopulations. (C) Bright field images (original magnification, x200) of passage 1 (upper row) and renewal (lower row) parental, Inv, and Core cell neurospheres. The graphs show the number of spheres in green squares and the sphere size in red bars. Data are means ± SEM from counts of 10 wells. These experiments were repeated three times with similar results. (D) Immunofluorescence with indicated antibodies of Inv and Core renewal neurospheres. Note increased expression of GFAP in Core neurospheres and of nestin in Inv neurospheres. (E) TUNEL apoptosis assay of rapamycin-treated parental, Inv, and Core cells. Data are means ± SEM from quadruplicates. These experiments were repeated three times with similar results.
Figure 5
Figure 5
Erk and Akt are differentially activated in Inv versus Core cells. (A) Western blot analysis of phosphorylated P-Erk in three pairs of Core and Inv cells derived from three mice (Figure 1A). P-Erk levels were normalized to total Erk1 (P-Erk/Erk), and results were represented as means ± SEM from two experiments. The panels show results from Pair #1 compared to parental (Par) cells. The percentage P-Erk/Erk activation (act.) is indicated under the corresponding bands. (B) IHC with P-Erk antibody of tumor sections from mice injected with Inv and Core cells showing high nuclear P-Erk levels in Core tumor cells. (C) Western blot with P-Akt (Ser473) antibody and analysis of P-Akt/Akt activation in the three sets of Inv/Core cells as in panel A. (D) IHC with P-Akt antibody of Inv and Core tumor tissue sections showing higher P-Akt cytoplasmic levels in Inv tumor cells. (E) PHLPP1 and PHLPP2 levels in parental, Inv, and Core cells. The graph represents PHLPP1 and PHLPP2 levels normalized to actin.
Figure 6
Figure 6
Model of GBM cell invasion. The initial parental population is most likely a mixture of different cell subsets, including putative giant cell precursors giving rise to the giant cell tumors from Figure 1. The cells giving rise to the parental-like (P-like) tumors interact with the brain microenvironment that enriches their stem cell-like state. The resulting Core and Inv cells may also contain different proportions of two cell types: cancer stem cells (expressing nestin) and cancer cells (expressing GFAP). These different proportions would confer the Inv and Core cells their phenotype and signaling signatures.

Similar articles

Cited by

References

    1. Ohgaki H, Kleihues P. Genetic pathways to primary and secondary glioblastoma. Am J Pathol. 2007;170:1445–1453. - PMC - PubMed
    1. Hadjipanayis CG, Van Meir EG. Tumor initiating cells in malignant gliomas: biology and implications for therapy. J Mol Med. 2009;87:363–374. - PMC - PubMed
    1. Furnari FB, Fenton T, Bachoo RM, Mukasa A, Stommel JM, Stegh A, Hahn WC, Ligon KL, Louis DN, Brennan C, et al. Malignant astrocytic glioma: genetics, biology, and paths to treatment. Genes Dev. 2007;21:2683–2710. - PubMed
    1. McGillicuddy LT, Fromm JA, Hollstein PE, Kubek S, Beroukhim R, De Raedt T, Johnson BW, Williams SM, Nghiemphu P, Liau LM, et al. Proteasomal and genetic inactivation of the NF1 tumor suppressor in gliomagenesis. Cancer Cell. 2009;16:44–54. - PMC - PubMed
    1. Park JB, Kwak HJ, Lee SH. Role of hyaluronan in glioma invasion. Cell Adh Migr. 2008;2:202–207. - PMC - PubMed

Publication types

MeSH terms

Substances